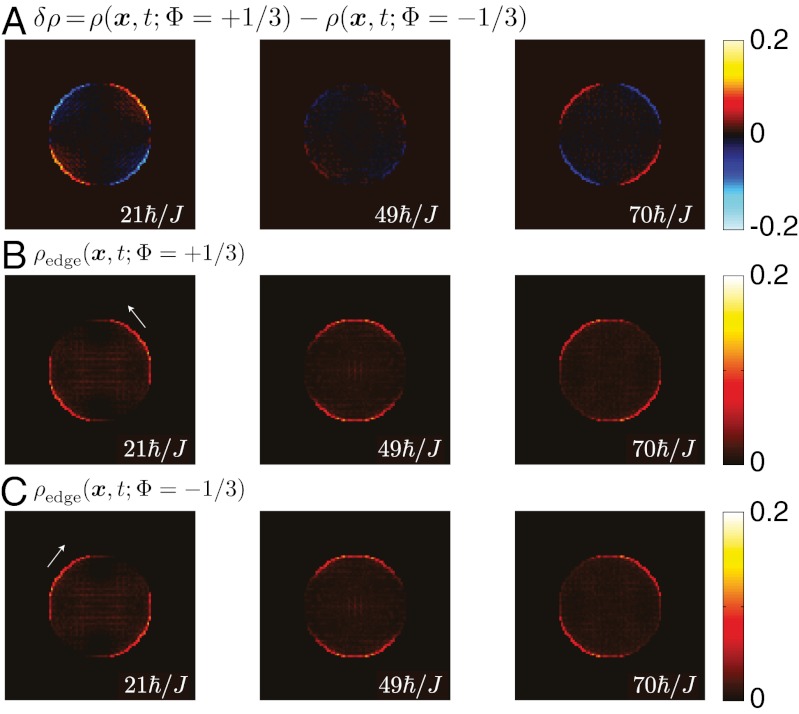
Fig. 5.
The opposite-flux method for dispersive systems. (A) Evolution of the difference  , for the same configuration as in Fig. 3. This method yields a clear manifestation of the edge states,
  , by eliminating the undesired contribution of the many bulk states. The edge states chirality is deduced from the evolution of the red and blue patterns. (B) The edge-states contribution
  for
for  and (C) for
  . In the central column, we note the vanishing of the signal
  that occurs at time
  , indicating that the edge states angular velocity is
  for
for  and
and  (SI Appendix).

