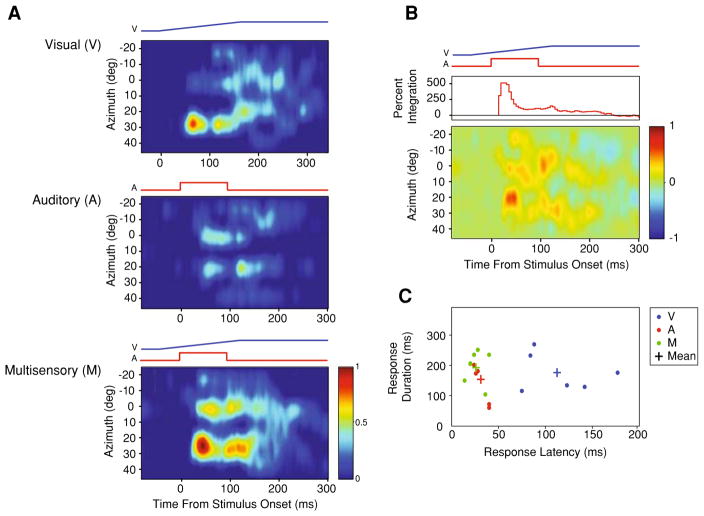
Fig. 2.
STRFs produced from a visual-auditory multisensory neuron recorded from cortical area AES. a Visual (top), auditory (middle), and multisensory (bottom) STRFs aligned such that the relative timing of the stimuli depicted in the multisensory condition is preserved across panels. b The difference STRF generated by subtracting the predictive multisensory STRF (linear sum of the visual and auditory STRFs) from the true multisensory STRF. Warmer colors reflect areas where the actual multisensory response exceeds the predicted multisensory response. The curve shown in the top panel represents the magnitude of multisensory integration (%) as the response evolves over time. c Scatterplot highlights the relationship between response latency and response discharge duration plotted as a function of the stimulus condition. Plus signs represent the mean values for each stimulus condition. Note the leftward and upward shift in the multisensory response relative to the auditory and visual responses, reflecting the speeded and longer lasting responses, respectively

