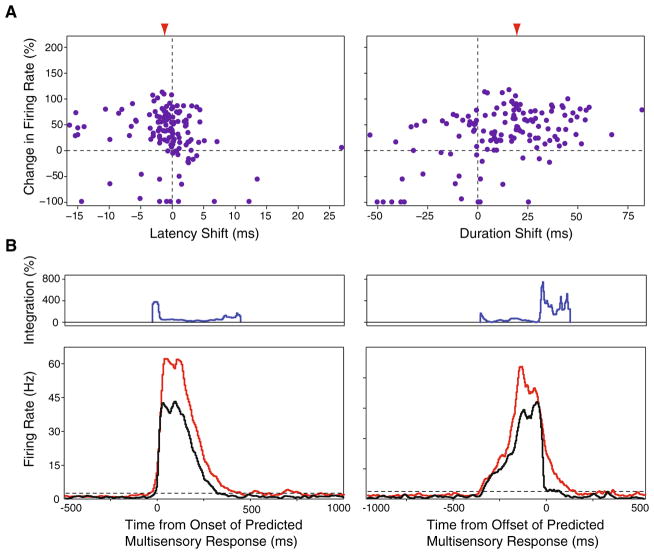
Fig. 4.
Spatiotemporal response dynamics of multisensory AES neurons. a Relationship between the relative change in firing rate between the multisensory and predicted multisensory conditions as a function of the concomitant shifts in evoked response latency (left panel) and duration (right panel). Left panel each point represents a response from one neuron at one tested stimulus location. Points to the left of the origin represent conditions where the multisensory response was faster than the predicted multisensory response. Right panel points to the right of the origin represent conditions where the multisensory response discharge duration was longer than the predicted multisensory response. Red arrowheads indicate the mean shift in latency (left panel) and duration (right panel). b Temporal patterns of multisensory response and multisensory integration in relation to the onset and offset of the predicted multisensory response. Top temporal pattern of multisensory integration. Bottom collapsed evoked response profiles for the predicted multisensory (black), and the multisensory (red) conditions aligned to the predicted multisensory response’s onset (left panel) and offset (right panel). As shown by the individual examples in Figs. 2 and 3, the greatest amount of integration tends to occur towards to onset and offset of the stimulus evoked response, corresponding to the shorter response latencies and longer discharge durations recorded under the multisensory conditions

