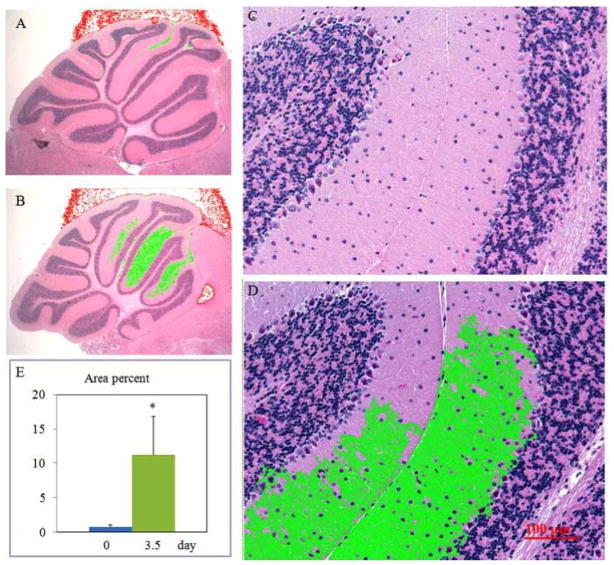
Fig. 2.
Image analyses identifying irradiation-induced morphological changes in the cerebellar molecular layer (refer to “Materials and Methods” section). Representative light micrographs with low (A&B) and high (C&D) magnifications exhibit Folia II~IV of the cerebellar vermis from control (A&C) and irradiation-challenged (3.5 day group, B&D) animals. The low density regions highlighted in green are automatically selected by computer software (AxioVision ver 4.7) after pre-inputing a density extent. In high magnification, deformed fiber-like structures along with the empty matrix space are identified (C&D). Ratio changes of green color area to total area of the sagittal sections of the cerebella vermis are summarized in E. *p<0.05 vs. the 0 day (control) group.

