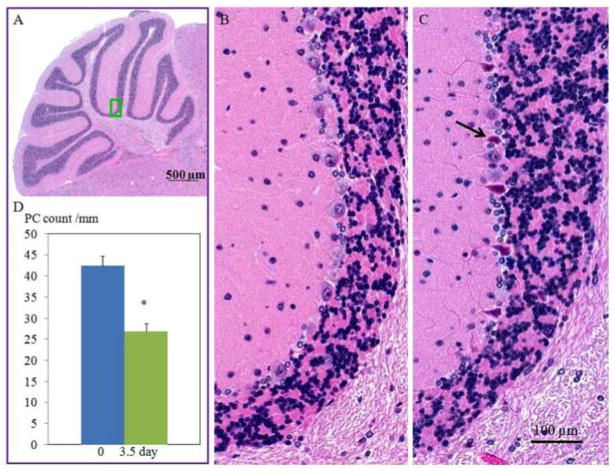
Fig. 3.
Micrographs showing cerebellar Purkinje cell morphology with or without TBI challenge (3.5 day). A green square in (A) highlights the location of where the representative micrographs (B, control animal; C, irradiation-challenged animal) were acquired. Arrows in (C) indicate degenerated Purkinje cells. Changes in Purkinje cell counts are summarized in D. *p<0.05 vs. the 0 day (control) group.

