
Fig. 1.
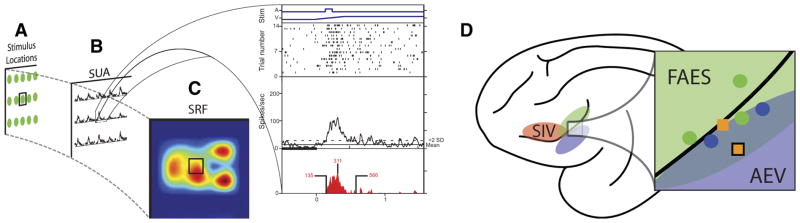
Construction of spatial receptive field (SRF) plots and location of recorded neurons. A: an example array of spatial locations (green dots) in which visual, auditory, and paired visual–auditory stimuli are presented to a multisensory neuron. B: the single-unit activity (SUA) at each of the tested locations is represented as stimulus-evoked spike density functions. The expansion box shows the raw data for a multisensory response at a single location and is composed of 4 panels. The top panel shows the visual (V: movement depicted by ramp) and auditory (A: square wave) stimulus onset and offset times. The 2nd panel shows a raster plot of the neuronal response, with each dot representing an action potential and each row representing a single trial. The 3rd panel shows a collapsed spike density function, with the dotted line representing the response level 2SDs above baseline (i.e., the response criterion). The bottom panel shows only the statistically defined evoked response (red shading) and illustrates various aspects of the temporal dynamics (onset, peak, and offset) of the evoked response. C: the evoked response at each location is then normalized to the greatest elicited response across conditions, with the warmth of the color representing the magnitude of the response. D: shown on the schematic view of lateral surface of the cat brain is the location of electrode penetrations through anterior ectosylvian sulcus (AES) cortex for one animal. Colored shading highlights the 3 unisensory subdivisions of the AES cortex: 4th somatosensory cortex (SIV, red), auditory field AES (FAES, green), and anterior ectosylvian visual area (AEV, blue). The circles represent penetrations in which only unisensory units were isolated, with the color representing the effective modality (visual: blue; auditory: green). Squares represent penetrations in which multisensory neurons (visual–auditory) were isolated and recorded; the black outlined square represents the location of the penetration in which the unit in Fig. 4 was recorded. Note that multisensory units were isolated on penetrations located on the border between FAES and AEV. Due to the complex geometry of the AES, only penetrations in which the approach angle was equivalent are shown in this figure.