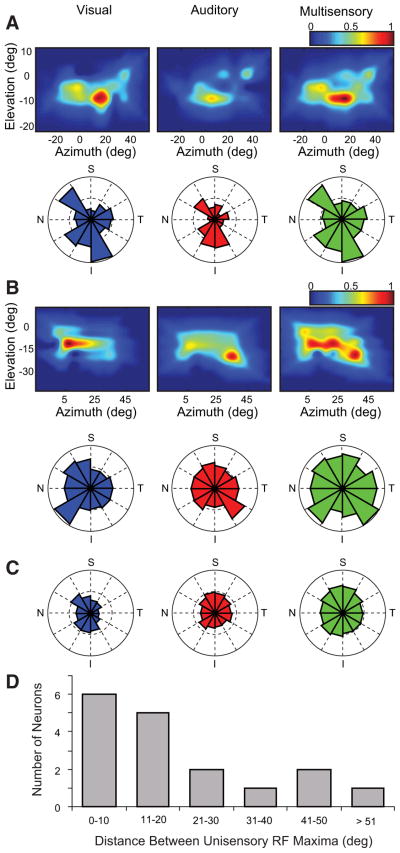
Fig. 2.
Examples of response heterogeneity in the SRFs of cortical multisensory neurons. A: the visual, auditory, and multisensory SRFs for the region of receptive field overlap in an AES neuron (SRFs constructed as detailed in Fig. 1). Each of the 3 representations has been normalized to the greatest evoked response, with the pseudocolor plots showing the relative activity scaled to this maxima. Below the SRFs are polar plots in which the center of the plot is the geometric center of the tested area of overlap. The magnitude of each wedge is proportional to the evoked response in that region of the receptive field, normalized across conditions (N, nasal; T, temporal; S, superior; I, inferior). B: an example of SRF and polar plots for a second AES multisensory neuron. Note in this example the substantial disparity between the visual and auditory SRFs. C: polar plot representations (grand mean) for the population of AES multisensory neurons. D: the distribution of the population of AES neurons plotted as a function of the Cartesian distance separating the location of the maximal visual and auditory responses. Note that the majority of neurons have a relatively close correspondence (i.e., <20°).

