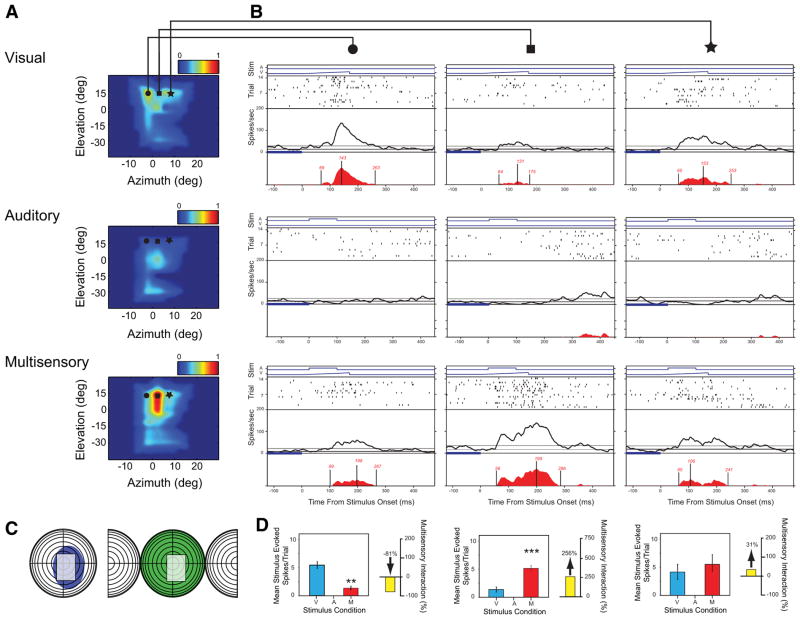
Fig. 3.
Multisensory interactions in AES neurons can differ widely as a function of the location of the paired stimuli. A: visual, auditory, and multisensory SRFs plotted using an identical convention to that described in Figs. 1 and 2. Symbols relate to the spatial locations of the stimulus pairings represented in B. B: rasters and spike density functions (see expansion box of Fig. 1B) show the details of this neuron’s responses to the visual stimulus alone (top row), auditory stimulus alone (middle row), and the combined visual–auditory stimulus (bottom row) presented at 3 different azimuthal locations (circle, square, and star on the receptive field plots in A show the stimulus locations; columns show the evoked responses at these 3 different locations). C: conventional representations of receptive fields for this neuron, in which the shaded areas (blue: visual; green: auditory) depict the classically defined excitatory receptive field. In these plots, concentric circles represent 10°, with the split hemisphere on the auditory representation depicting caudal (behind the interaural plane) space. The gray area highlights the area of receptive field overlap in which the SRF plots were constructed. D: summary bar graphs illustrate the mean responses for the visual (blue), auditory (green), and multisensory (red) conditions, and the magnitude of the multisensory interaction (yellow) at each spatial location (**P < 0.01, ***P < 0.001). Note that despite the identical characteristics of the stimuli for each of these conditions (i.e., they vary only in spatial location), the magnitude of the visual response and the multisensory gain changes dramatically, shifting from response depression (circle column), to response enhancement (square column) to no interaction (star column).

