
Fig. 6.
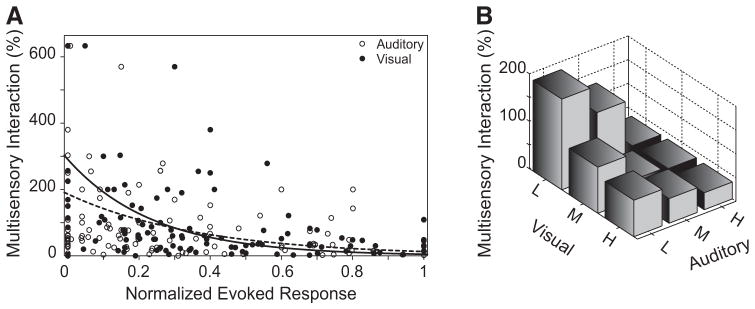
Changes in the multisensory interactive profile of AES neurons as a function of spatial location adhere to the principle of inverse effectiveness. A: a scatterplot of the magnitude of the multisensory interaction as a function of the normalized visual (black diamonds) or auditory (open circles) responses. The curves of best fit (modeled for both conditions with the exponential function [a × exp(bx)] for the visual (black dashed line, r2 = 0.1238) and auditory (solid black line, r2 = 0.2732) responses both show that as the magnitude of the evoked responses increase, the relative multisensory gain (i.e., interactive index) decreases. B: the bar graph divides normalized sensory evoked responses into low (L, 0–0.33), medium (M, 0.34–0.66), and high (H, 0.67–1.00) values across both sensory domains and shows that the largest multisensory interactions are found to pairings at locations where weak evoked stimulus responses are found (L visual, L auditory). In contrast, the smallest multisensory interactions are found at locations where maximal evoked stimulus responses (H visual, H auditory) are found in both domains. Note that as either of the unisensory responses increases independently there is a decrease in the size of the multisensory interaction.