
Figure 2.
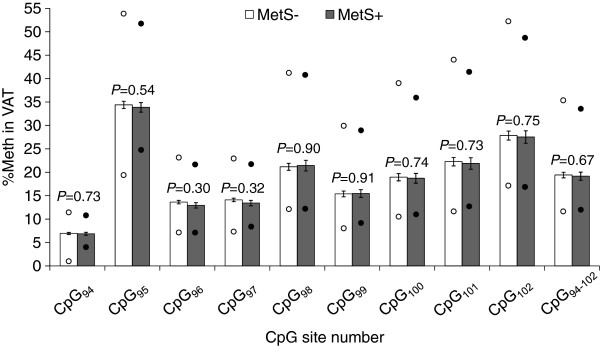
VAT methylation levels and their comparison between MetS− and MetS+ groups in severely obese subjects. Non-normally distributed%Meth levels were transformed for the analysis using the negative inverse (-1/X) for CpG98, CpG99, CpG100, CpG101, CpG102 and CpG95-102. Mean±s.e.m. are presented in the figure. MetS−: n=72 subjects; MetS+: n=33 subjects. Lower circles: minimum%Meth value; Upper circles: maximum%Meth value. NT, not-tested; s.e.m., standard error of mean.