
Figure 3.
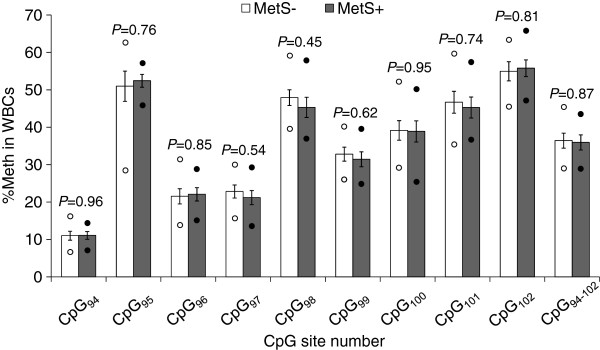
WBCs methylation levels and their comparison between MetS− and MetS+ groups in severely obese women. Mean±s.e.m. are presented in the figure. Lower circle: minimum %Meth value; Upper circle: maximum %Meth value. MetS−: n=9 women; MetS+: n=8 women. NT, not-tested; s.e.m., standard error of mean.