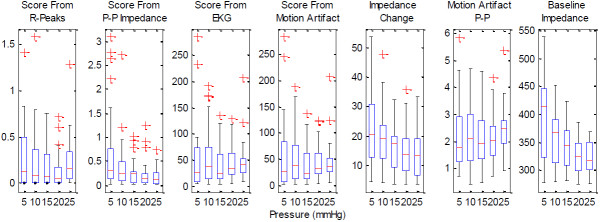
Figure 5.

The boxplots of various parameters obtained from the experiments utilizing the paddings. The parameters shown are the score obtained from R-peak detection, the scores obtained from the energies of the 1 Hz–7 Hz band components of the impedance signal, ECG signal and the motion artifact, the peak-to-peak values of the motion artifact and the baseline impedance.
