Figure 8.

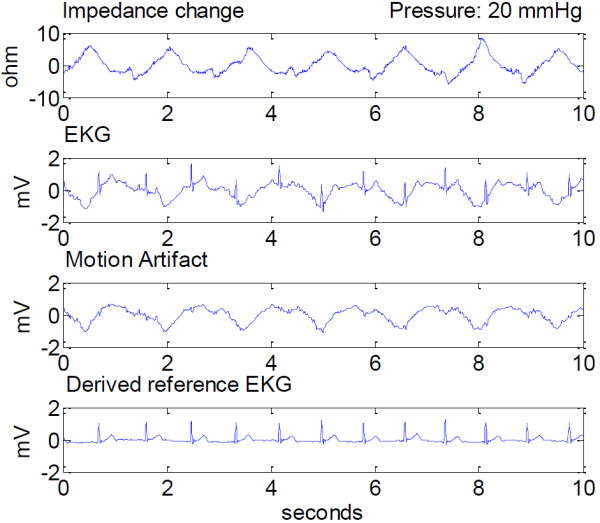
Measured impedance change, ECG and motion artifact, and the derived chest ECG at 20 mmHg applied pressure. Signals are presented after 0.3Hz–30 Hz band-pass filtering, and shown in a 10 second window.

Measured impedance change, ECG and motion artifact, and the derived chest ECG at 20 mmHg applied pressure. Signals are presented after 0.3Hz–30 Hz band-pass filtering, and shown in a 10 second window.