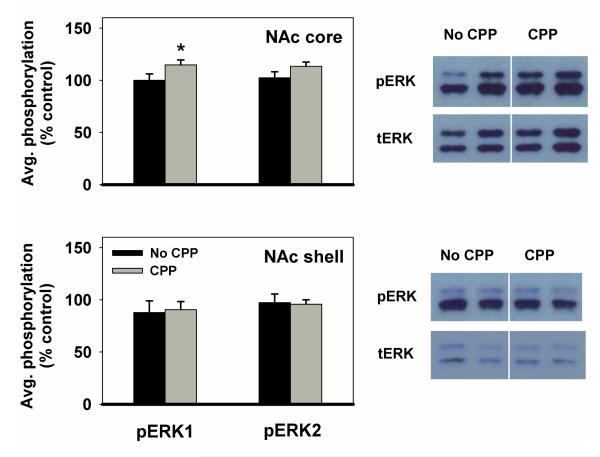
Figure 8. pERK1 and pERK2 levels in the nucleus accumbens of CPP vs. non-CPP expressing rats.
Results obtained in NAc core (top) and shell (bottom) (mean ±SEM) are expressed in comparison to the normalized control, which is defined as the non-CPP expressing group. Data from AM and PM fed groups were combined because of the lack of behavioral difference between groups. *p<0.05

