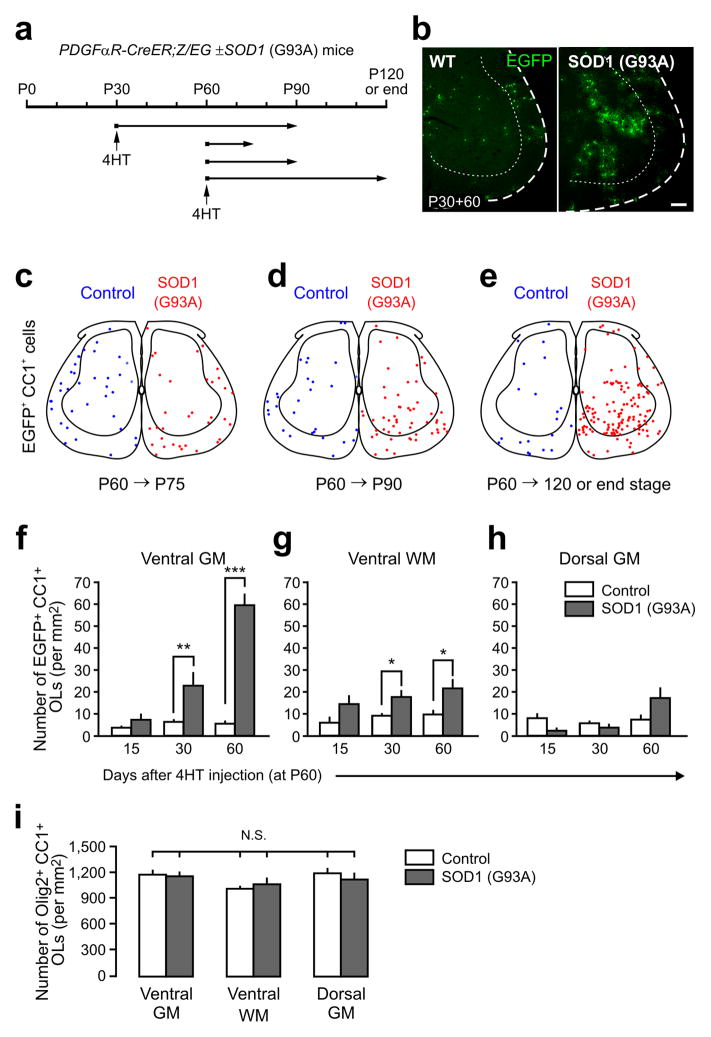
Figure 2.
Enhanced oligodendrogenesis in the spinal cord gray matter of adult ALS mice. (a) Protocol used to trace the fate of NG2+ cells in PDGFαR-CreER;Z/EG ± SOD1 (G93A) mice. Cohorts of NG2+ cells were labeled with EGFP by 4HT injection at P30 or P60 then analyzed at different ages. (b) Fluorescence images showing EGFP+ NG2+ cell progeny in the ventral horn of the spinal cord in control or SOD1 (G93A) mice 60 days after 4HT administration at P30 (P30+60). Scale bar: 100 μm. (c – e) Maps of the location of adult born oligodendrocytes generated from NG2+ cells in the spinal cord of control (blue circles) or SOD1 (G93A) mice (red circles), from P60 to P75 (c), from P60 to P90 (d), or from P60 to P120 (or end stage for ALS mice) (e). Oligodendrocytes (EGFP+CC1+) in four randomly sampled lumbar spinal cord sections from each group (from 3–4 mice) are shown. (f – h) Graphs showing the density of newly generated EGFP+ CC1+ oligodendrocytes in different regions of the adult spinal cord from control (white bars) and SOD1 (G93A) mice (gray bars). Mean + s.e.m. (n = 9 sections from 3 mice per group) * P < 0.05, ** P < 0.001, *** P < 0.0005, unpaired Student’s t test. i) Graph showing the overall density of oligodendrocytes (Olig2+CC1+) in different regions of the spinal cord of P120 and end stage SOD1 (G93A) mice. Mean + s.e.m. (n = 12 sections per group from 4 mice per group) N.S., non-significant, one-way ANOVA with Tukey test.

