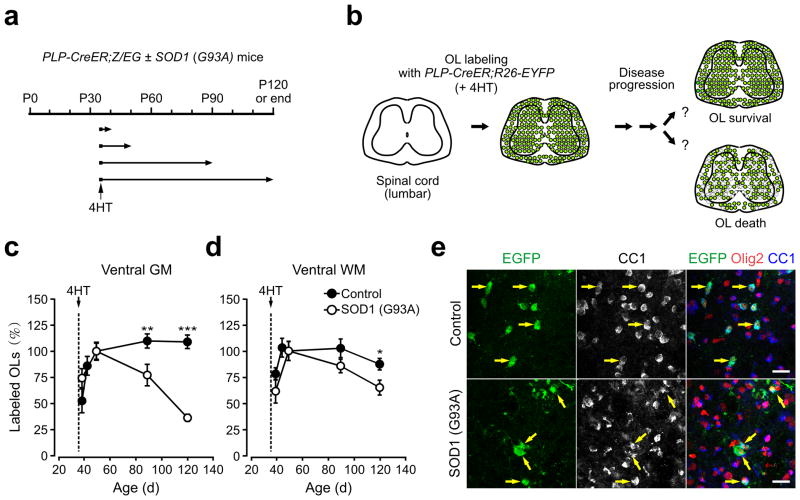
Figure 3.
Progressive degeneration of oligodendrocytes in the spinal cord ventral gray matter of ALS mice. (a) Protocol used to track the fate of early-born oligodendrocytes. Littermate control and SOD1 (G93A) expressing PLP-CreER;ROSA26-EYFP mice received 4HT (2 mg) at P35 and were analyzed at P40, P50, P90 and P120 (or end stage for ALS mice). (b) Schematic showing the rationale and possible outcomes of oligodendrocyte fate analysis. (c,d) Plot of the number of EYFP+ oligodendrocytes (CC1+Olig2+) in ventral gray mater (GM) (c) and ventral white matter (WM) (d) of PLP-CreER;ROSA26-EYFP ± SOD1 (G93A) mice, expressed relative to the number observed at P35+15 (P50). Note that control group had additional time point (P35+10). Means ± s.e.m. (n = 9 sections from 3 mice per each time point of each group). * P < 0.05, ** P < 0.001, *** P < 0.0005. Unpaired Student’s t-test was used to compare mean values between control and SOD1 (G93A) mice at each time point. One-way ANOVA with Tukey test was used for age-dependent relative changes in EYFP+ oligodendrocytes in each group. (e) Confocal images showing the density and morphology of EYFP+ (stained with anti-EGFP antibody) CC1+Olig2+ spinal cord oligodendrocytes (yellow arrows) in ventral gray matter at P120 (control) or at end stage SOD1 (G93A) mice. Scale bars: 20μm.

