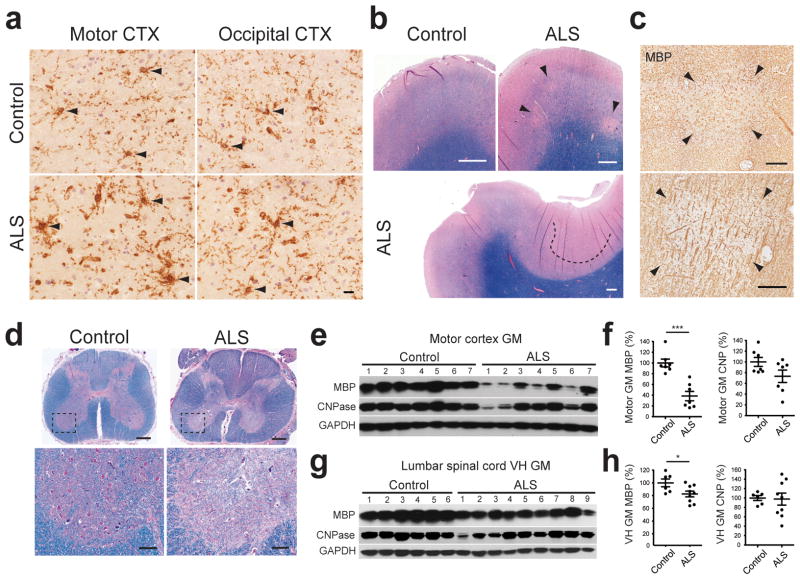
Figure 7.
Demyelination in gray matter regions of the motor cortex and spinal cord in human ALS. (a) Sections of motor cortex gray matter from control and ALS patients showing immunoreactivity to NG2. NG2+ cells are highlighted by arrowheads. See NG2/Iba1 co-immunostained images in Supplementary Fig. 8a. Images were acquired from cortical layers IV and V. Scale bars: 20 μm. (b) Luxol fast blue staining of motor cortices from control subjects and ALS patients. Demyelinated lesions are highlighted by arrowheads (upper right panel) or a dashed line (lower panel). (c) MBP immunoreactivity in ALS motor cortex. Adjacent sections to those shown in the upper right and lower panels in (b) were used. Images show demyelinated plaques in layer III (upper panel) and layer V (lower panel). (d) Sections of lumbar spinal cord from an ALS patient stained with Luxol fast blue showing demyelination in the ventral horn gray matter and lateral corticospinal tract (arrowhead). Lower panels are higher magnification images of the boxed regions in the upper panels. Scale bars: 1 mm (b,d upper panels); 200 μm (c,d lower panels). (e, g) Western blots of oligodendrocyte lineage-specific myelin proteins in motor cortex gray matter (e) and lumbar spinal cord ventral horn grey matter (g) from controls and ALS patients. Full-length blots are presented in Supplementary Fig. 11. (f, h) Graphs of MBP and CNPase protein expression levels (measured by Western blot) in the motor cortex (f) and lumbar spinal cord ventral horn (h) gray matter in controls and ALS patients, normalized to average value in controls. Mean ± s.e.m. with individual values. * P < 0.05, *** P < 0.0001, unpaired Student’s t-test.

