
Figure 3.
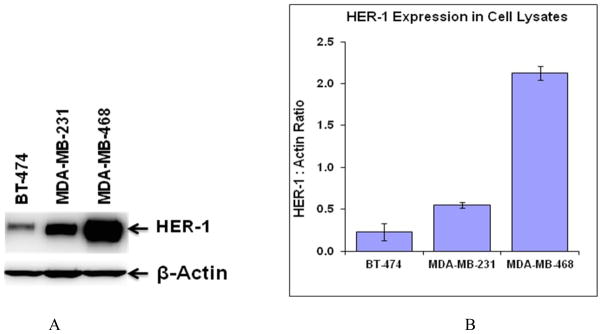
Comparative EGFR expression level of BT-474, MDA-MB-231, and MDA-MB-468 cell lines by western blot analysis (A). Quantitation of each band was performed using Carestream Molecular Imaging Software v5.0.2.30 and data is presented as HER-1/Actin ratio from six blots (B). Data expressed as the mean of the values ± the standard deviation.