Fig. 2.
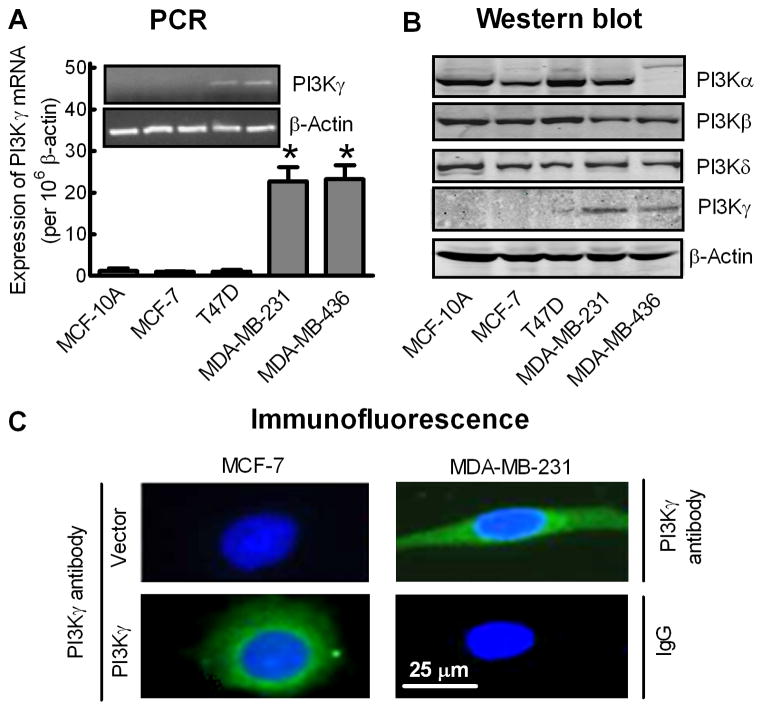
Aberrant expression of PI3Kγ in human metastatic breast cancer cell lines. (A) Analysis of PI3Kγ mRNA expression in breast cell lines by quantitative real-time PCR. Bars represent the mean ± S.E. of PI3Kγ mRNA levels, normalized by β-actin expression levels (n=4). *p<0.01 compared to MCF-10A cells. Inset: Conventional PCR for PI3Kγ (35 cycles) and β-actin (25 cycles). (B) Western blot analysis of PI3Kα, PI3Kβ, PI3Kγ and PI3Kδ protein expression levels in breast cell lines. β-actin was used as an internal control. Images shown are representative of four separate experiments. (C) Immunofluorescence staining of PI3Kγ protein (green) with DAPI staining of the nuclei (blue) in MDA-MB-231 cells and MCF-7 cells transfected with vector or PK3Kγ. The negative control used non-immune rabbit IgG as the primary antibody. Images shown are representative of at least 50 cells from three separate experiments.

