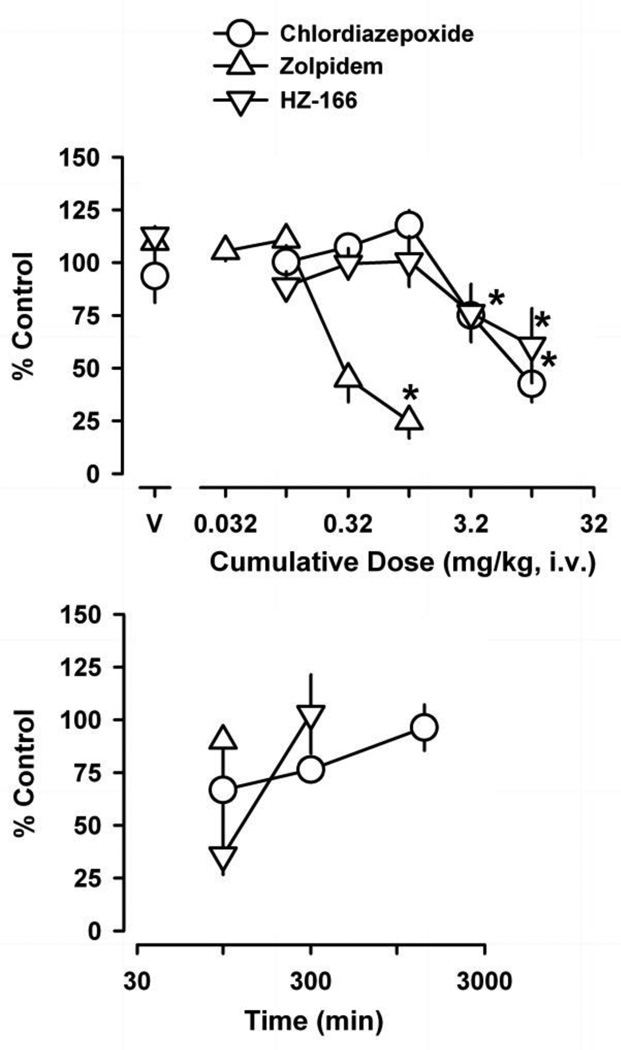
Figure 1.
Dose-effect curves (top panel) and time-course (bottom panel) of the positive GABAA receptor modulators chlordiazepoxide, zolpidem and HZ-166 on schedule-controlled responding. Abscissae, dose of drug in milligrams per kilogram or time after drug administration. Ordinate, mean (±SEM) rate of responding as percentage of control. Points above “V’ indicate average rates of responding (±SEM) following vehicle administration. Asterisks represent significant differences relative to vehicle (Bonferroni t-tests, p<0.05). Time-course data were determined following the highest dose tested for each drug (10 mg/kg chlordiazepoxide, 1 mg/kg zolpidem and 10 mg/kg HZ-166).

