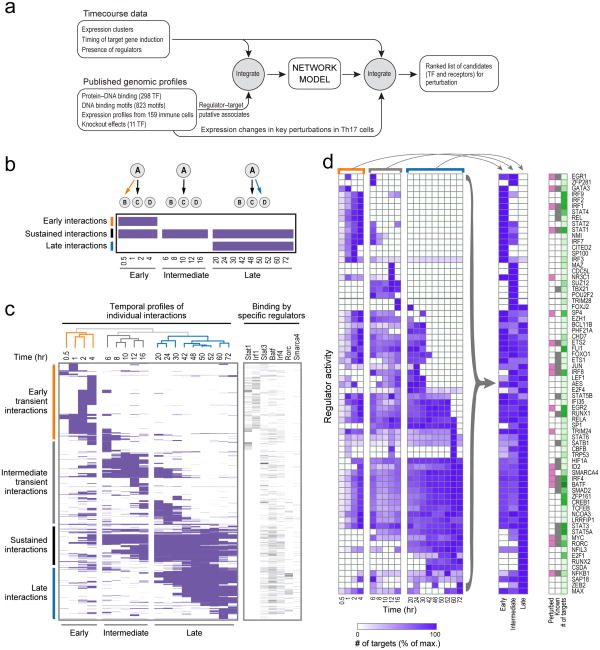
Figure 2. A model of the dynamic regulatory network of Th17 differentiation.
(a) Overview of computational analysis. (b) Schematic of temporal network ‘snapshots’. Shown are three consecutive cartoon networks (top and matrix columns), with three possible interactions from regulator (A) to targets (B, C & D), shown as edges (top) and matrix rows (A→B – top row; A→C – middle row; A→D – bottom row). (c) 18 network ‘snapshots’. Left: each row corresponds to a TF-target interaction that occurs in at least one network; columns correspond to the network at each time point. A purple entry: interaction is active in that network. The networks are clustered by similarity of active interactions (dendrogram, top), forming three temporally consecutive clusters (early, intermediate, late, bottom). Right: a heatmap denoting edges for selected regulators. (d) Dynamic regulator activity. Shown is, for each regulator (rows), the number of target genes (normalized by its maximum number of targets) in each of the 18 networks (columns, left), and in each of the three canonical networks (middle) obtained by collapsing (arrows). Right: regulators chosen for perturbation (pink), known Th17 regulators (grey), and the maximal number of target genes across the three canonical networks (green, ranging from 0 to 250 targets).

