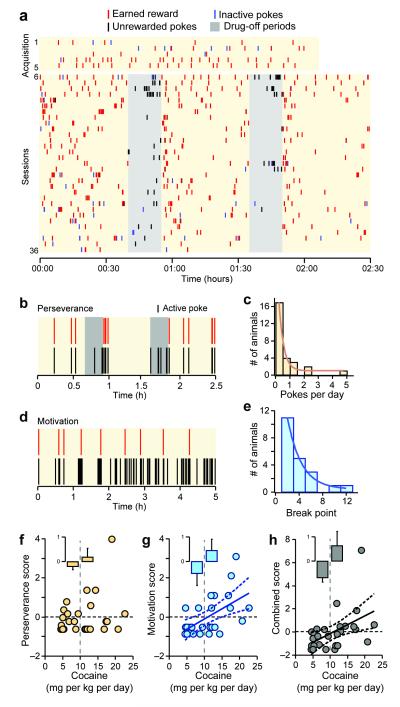
Figure 1. Individual variability in the behaviors towards cocaine after extended self-administration.
(a) Raster plot showing the daily pattern of cocaine self-administration of a mouse during acquisition (day 1-5) and sessions (day 6-36). Red ticks = earned cocaine infusions, blue ticks = inactive pokes, black ticks = unrewarded active pokes, and shaded area= drug-off period. (b) Example of perseverative responding during the drug-off periods in session 35; red tick = cocaine infusion, black tick = active poke. (c) Distribution of the perseverance value (mean active pokes/day during drug-off) within the population. Line is log normal fit to the data (with yo=16.5, A=−14, xo=1.5, width=4; x2=22.9; n=10 mice). (d) Example of responding during progressive ratio session used to measure motivation. The number of active pokes (black ticks) required to earn a cocaine infusion (red tick) increases with each subsequent infusion. (e) Distribution of the breakpoint values within the population. Line is log normal fit to the data (with yo=15.5, A=−9, xo=10.8, width=2.2; x2=1.7; n=6 mice). (f, g, h) The scores of individual mice for perseverance (f), motivation (g) and combined bahevioral scores versus cocaine intake. Vertical dash line marks 10 mg/kg/day cocaine dose and horizontal dash line marks the mean of score (zero). Insets, mean ± SEM perseverance score for mice with cocaine intake (left) lower and (right) higher than 10 mg/kg/day.Solid and dash lines represent linear regression fit and 95% confidence interval.

