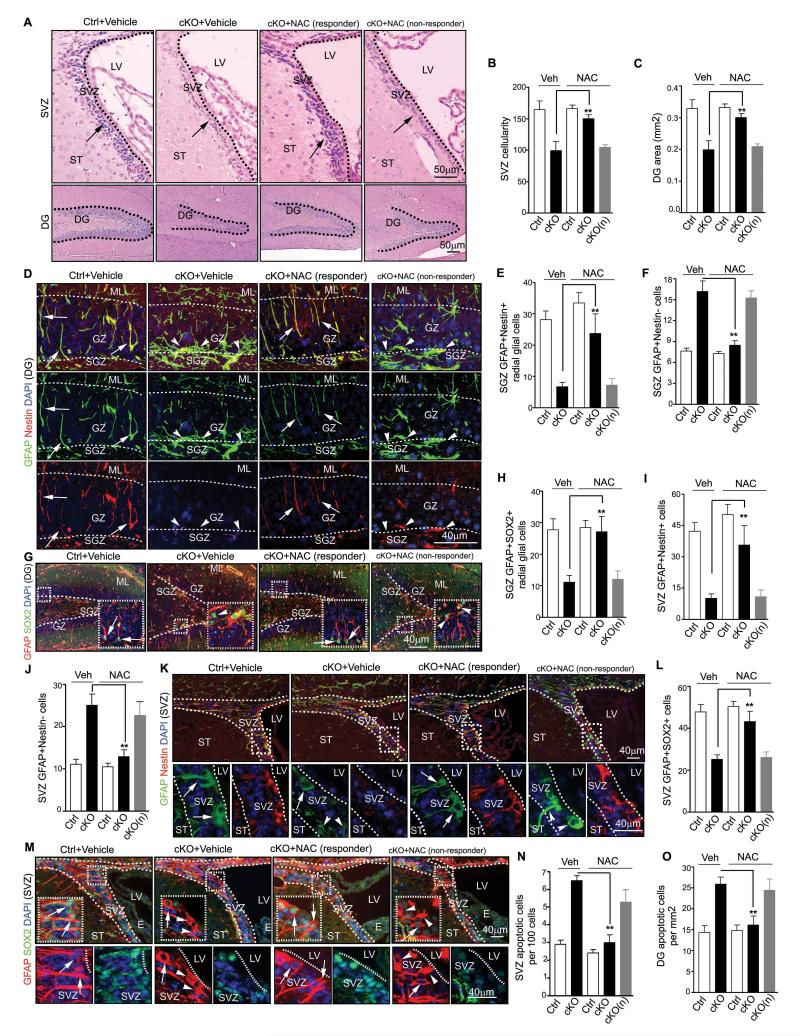
Figure 7. Rescue of NSCs maintenance in FIP200hGFAP cKO mice by scavenging abnormally elevated ROS.
(A-C) H&E staining of the SVZ and DG of P28 mice treated by NAC or vehicle control. Lines indicate boundaries for the SVZ and DG. Arrows mark cells in the SVZ. Mean±SE of the SVZ cellularity (B) and DG area (C) per section are shown. (D-M) Immunofluorescence of the DG (D-H) and SVZ (I-M) of P28 mice treated by NAC or vehicle control. Representative images are shown in D, G (DG) and K, M (SVZ). Lines indicate boundaries of the GZ (D, G) and SVZ (K, M). The boxed areas in G, K and M are shown in more detail in insets (G) or panels below (K and M). Lines indicate boundaries of the GZ (D, G) and SVZ (K, M). Arrows mark GFAP+/Nestin+ and GFAP+/SOX2+ NSCs with radial glial morphology (D, G), and arrowheads mark GFAP+/Nestin− and GFAP+/SOX2− astrocytes. Mean±SE of the number of GFAP+/Nestin+ and GFAP+/SOX2+ radial glia (E, H), and NSCs (I, L), and GFAP+/Nestin− astrocytes (F, J) per section are shown. (N, O) Mean±SE of the number of TUNEL+ cells per 100 SVZ cells (N) or per 1 mm2 DG area (O) of P28 mice treated by NAC or vehicle control are shown. n= 5 mice, ≥4 sections/mouse, >500 cells counted/mouse in N. For all panels, cKO(n): NAC non-responder cKO mice.

