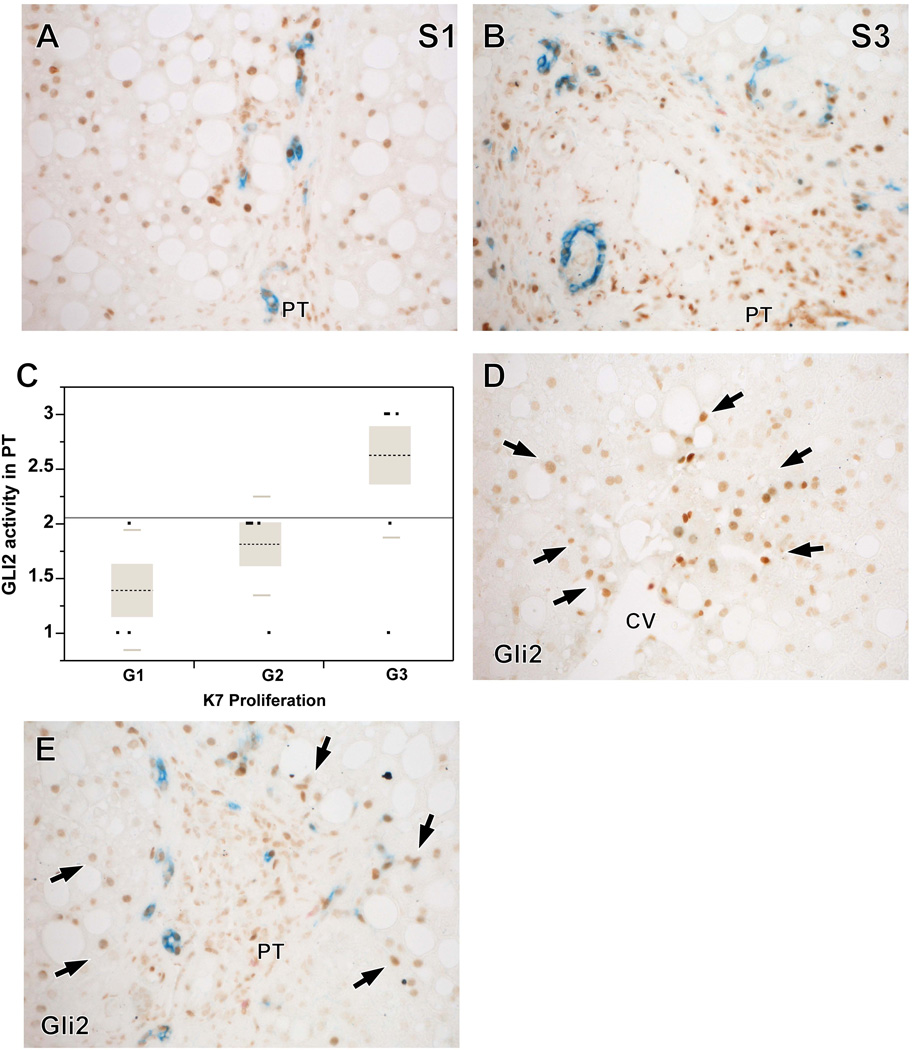
Figure 4. Patterns of Gli2 and K7 staining.
Higher fibrosis stages showed higher numbers of K7+ cells (progenitors/ductular cells, blue) and Gli2+ cells (Hh-responsive cells, brown) (A-B). There was a significant positive association between grades of Gli2+ PT cells and grades of K7+ PT cells (P <0.017) (C). Gli2+ hepatocytes (arrows) were also identified in the lobular parenchyma and showed a zone 3 dominant pattern (D) or a zone 1 dominant pattern (E) or a combined pattern of Gli2 staining.

