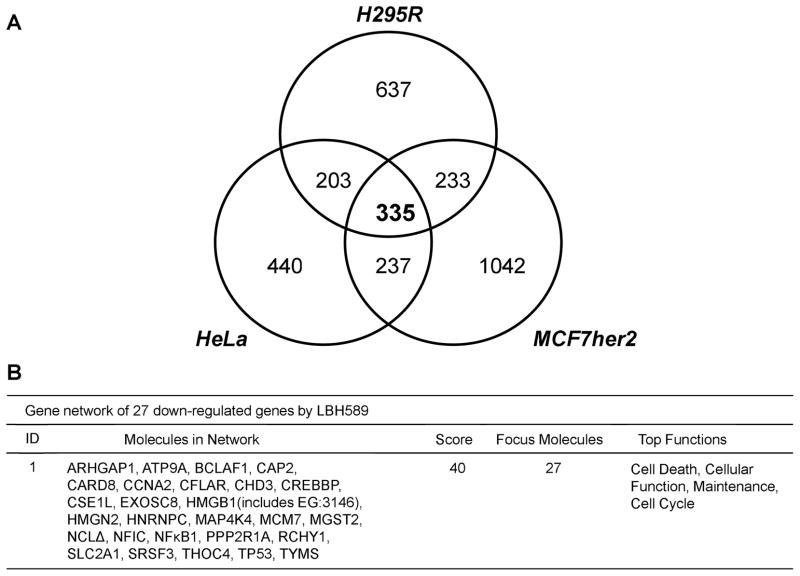
Fig. 4. Comparison of global gene expression profiles of three LBH589-treated cancer cell lines.
(A) Three cell lines (H295R, HeLa and MCF7her2) were treated with 50 nM LBH589 for 4 hours and gene expression analyzed by Affymetrix Human Gene 1.0 ST Array. Expression of 335 genes changed among all three cell lines after treatment. Genes with an FDR-adjusted p-value < 0.05 were considered to be differentially expressed and subjected to Venn analysis. Venn analysis was first performed by analyzing cell-line-specific alterations in differentially expressed genes in each cell line, and then by analyzing overlap between gene lists from different lines. (B) Gene network of down-regulated genes by LBH589. The most down-regulated network identified by Ingenuity Pathway Analysis contains 27 genes.

