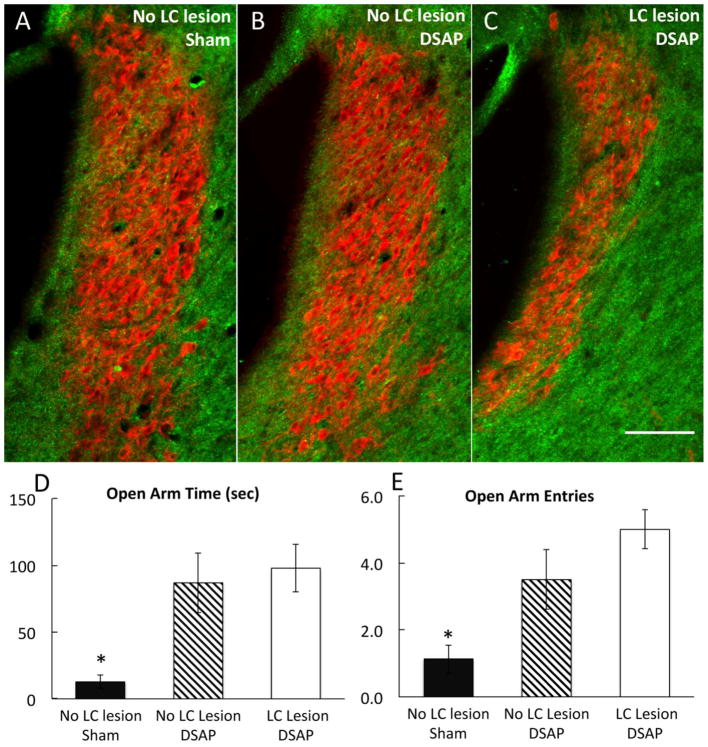
Figure 6.
Immunofluorescent localization of DbH (red) within the pontine LC (A6 NA cell group; bregma level −10.0 mm) in a sham-lesioned rat (A; no LC lesion), a DSAP rat from the subgroup displaying no apparent loss of DbH-positive LC neurons (B; no LC lesion), and a DSAP rat from the subgroup in which a loss of DbH-positive LC neurons is evident (C; LC lesion). Scale bar in C = 100 microns, applies also to A and B. Bar graphs illustrate time spent in the open arms of the EPMZ (D) and the number of open arm entries (E) by rats in each group after YO treatment (data represent group means ± SE). After YO treatment, sham-lesioned rats (n=16) spend significantly less time in the EPMZ open arms and make fewer open arm entries compared to both subgroups of YO-treated DSAP rats (n=6 per subgroup; *P < 0.01, sham vs. DSAP). Differences between DSAP subgroups were not significant.

