
Figure 4.
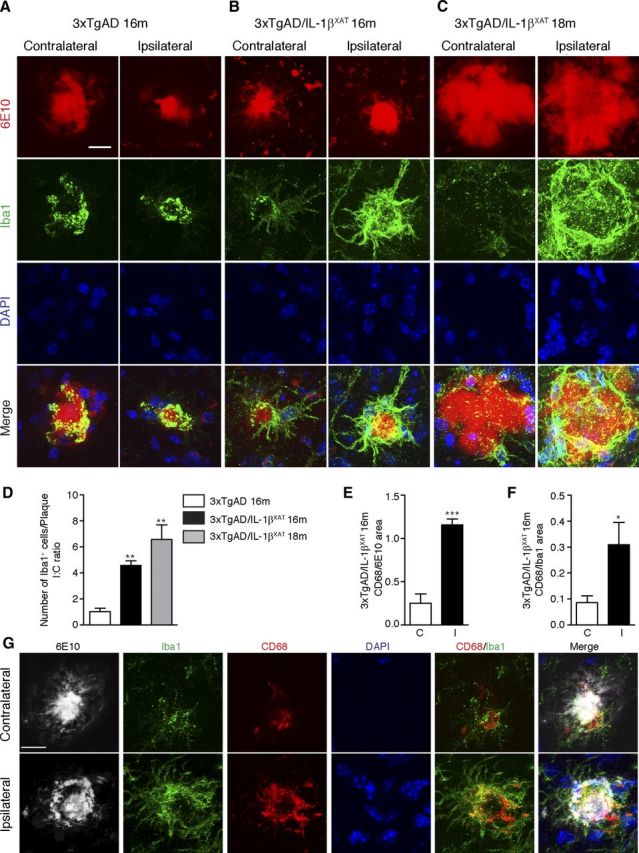
Sustained IL-1β overexpression enhances plaque-associated microglia in 3xTgAD/IL-1βXAT mice. Representative confocal micrographs of contralateral and ipsilateral subicular sections stained with Congo Red (fibrillar Aβ plaques), Iba-1 (microglia), and DAPI (nuclei) are shown. 3xTgAD/IL-1βXAT mice showed more plaque-associated microglia at 16 months (B) and 18 months (C) compared with their 3xTgAD counterparts (A) in the ipsilateral subiculum. Scale bars, 30 μm. On quantification, 3xTgAD/IL-1βXAT mice demonstrate approximately fourfold more plaque-associated microglia at 16 months and ∼6.5-fold more plaque associated microglia at 18 months in the ipsilateral subiculum compared with their 3xTgAD counterpart at 16 months (D). Data are shown as mean I/C ratio ± SEM of Iba1-positive cells per plaque; n = 3–4 mice per group. Data were analyzed with one-way ANOVA, followed by a Bonferroni's post hoc test; **p < 0.01. Quantitative results are shown for contralateral and ipsilateral hemispheres of 16-month-old 3xTgAD/IL-1βXAT mice brain sections stained with 6E10 (amyloid plaques), CD68 (activated microglia), Iba1 (microglia), and DAPI (nuclei). The ipsilateral subiculum demonstrates a 4.6-fold increase in CD68 area when normalized to plaque area (E). Data were expressed as mean CD68/6E10 area Fraction within a 500 pixel diameter around the plaques ± SEM for contralateral (C) and ipsilateral (I) subiculum. Analyzed by a paired Student's t test, ***p < 0.001; n = 4 mice. The ipsilateral subiculum also demonstrates a 3.5-fold increase in CD68 area when normalized to Iba1 area (F). Data were expressed as mean CD68/Iba1 area fraction within a 500 pixel diameter around the plaques ± SEM for contralateral (C) and ipsilateral (I) subiculum. Analyzed by a paired Student's t test, *p < 0.05; n = 4 mice. G, Representative confocal micrographs from the experiment are shown. Scale bars, 20 μm.