
Figure 2.
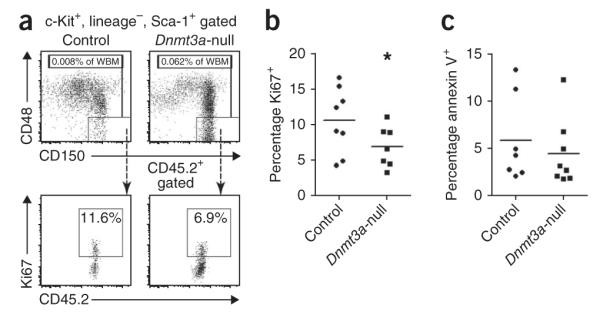
Cellular kinetics of Dnmt3a-null HSCs. (a) HSC gating scheme for the analysis of proliferation and apoptosis in secondary recipient mice transplanted with control or Dnmt3a-null HSCs. (b) Ki67 staining shows a significant reduction in the proliferative index of Dnmt3a-null HSCs relative to control HSCs; *P < 0.05. (c) Annexin V staining shows no difference in the apoptotic rate between control and Dnmt3a-null HSCs. Bars in b and c indicate the mean values for each genotype.