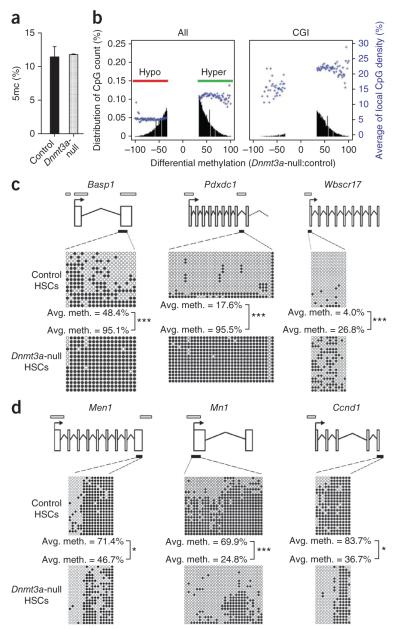
Figure 4.
Dnmt3a loss in HSCs results in both hyper- and hypomethylation. (a) HPLC-MS analysis of global 5mc levels as a proportion of the total cytosine in purified HSCs from secondary recipient mice (N = 2). (b) RRBS analysis of tertiary recipient mice transplanted with control or Dnmt3a-null HSCs. Plots show the degree of differential methylation (between Dnmt3a-null and control HSCs) and its relationship to local CpG density (blue). Left, all hypomethylated (red, CpGs ≤33% methylated) and hypermethylated (green, CpGs ≥33% methylated) DMCs in Dnmt3a-null HSCs. Right, DMCs located within CGIs. (c) Independent bisulfite sequencing analysis of selected hypermethylated CGIs in Dnmt3a-null HSCs. (d) Bisulfite sequencing analysis of selected hypomethylated genes in Dnmt3a-null HSCs. Schematic diagrams for each gene are shown in c and d (not to scale). Exons are represented by vertical rectangles. White horizontal bars indicate CGIs, and black horizontal bars show the tested region. Open and filled circles represent unmethylated and methylated CpGs, respectively. Differences in methylation between control and Dnmt3a-null cells that were statistically significant are indicated; *P < 0.05, ***P < 0.001.

