
Figure 6.
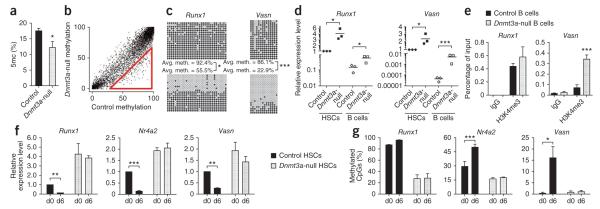
Dnmt3a is required to suppress the stem cell program in HSCs to permit differentiation. (a) HPLC-MS analysis of global 5mc levels as a proportion of the total cytosine in B cells from secondary recipient mice. Mean ± s.e.m. values are shown (N = 7 mice). (b) DREAM analysis of B cells in secondary recipient mice. SmaI sites with at least 20 sequence tags in control B cells are plotted showing the methylation ratio between the genotypes. The red triangle indicates sites of hypomethylation in Dnmt3a-null B cells in 1.4% of all CpGs (FDR = 0.07%). (c) Bisulfite sequencing across the Vasn and Runx1 CGIs in control (top) and Dnmt3a-null (bottom) B cells. Differences in methylation between control and Dnmt3a-null cells that were statistically significant are indicated. (d) Cognate gene expression for cells analyzed in c. Diamonds indicate control cells, and squares indicate Dntm3a-null cells. HSCs are represented by filled symbols and B cells by open symbols. Bars indicate the average gene expression for each cell population. Differences in expression between control and Dnmt3a-null cells that were statistically significant are indicated. (e) H3K4me3 ChIP analysis for Runx1 and Vasn in control and Dnmt3a-null B cells. Mean ± s.e.m. values are shown (N = 4 replicate experiments). (f) Expression of Dnmt3a-responsive genes at day 0 (d0) and day 6 (d6) after 5-FU exposure measured by real-time PCR. Expression levels are relative to normalized expression of that gene in d0 control HSCs. Mean ± s.e.m. values are shown, and statistically significant differences in expression at the two time points are indicated. (g) Proportion of methylated CpGs as detected by bisulfite sequencing across CGIs. Mean ± s.e.m. values are shown for three biological replicates, and statistically significant differences in methylation at the two time points are indicated. *P < 0.05, **P < 0.01, ***P < 0.001.