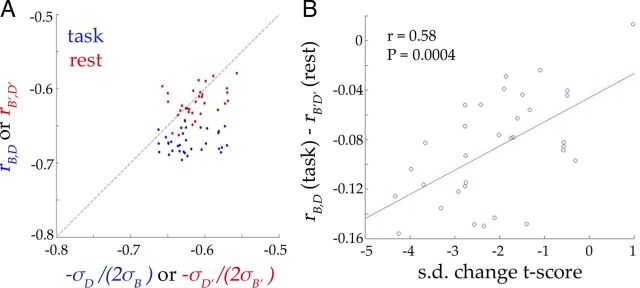
Figure 5.
Interaction between ongoing and evoked activity. A, rB,D is the correlation between B and D values across trials. σB and σD are the SDs of B and D values across trials respectively. rB′,D′, σB′, and σD′ are calculated using surrogate trials from rest data. Each dot represents one ROI (red, rest data; blue, task data). B, Correlation between SD change t score (paired t test on SD between peak frame at 5.4 s and the prestimulus frame) and the difference between rB,D and rB′,D′ (both Fisher z transformed) across ROIs. Red line indicates the best linear-regression fit.

