Abstract
A continuum mixture model with distinct collagen (COL) and glycosaminoglycan (GAG) elastic constituents was developed for the solid matrix of immature bovine articular cartilage. A continuous COL fiber volume fraction distribution function and a true COL fiber elastic modulus (Ef) were used. Quantitative polarized light microscopy (qPLM) methods were developed to account for the relatively high cell density of immature articular cartilage and used with a novel algorithm that constructs a 3D distribution function from 2D qPLM data. For specimens untreated and cultured in vitro, most model parameters were specified from qPLM analysis and biochemical assay results; consequently, Ef was predicted using an optimization to measured mechanical properties in uniaxial tension and unconfined compression. Analysis of qPLM data revealed a highly anisotropic fiber distribution, with principal fiber orientation parallel to the surface layer. For untreated samples, predicted Ef values were 175 and 422 MPa for superficial (S) and middle (M) zone layers, respectively. TGF-β1 treatment was predicted to increase and decrease Ef values for the S and M layers to 281 and 309 MPa, respectively. IGF-1 treatment was predicted to decrease Ef values for the S and M layers to 22 and 26 MPa, respectively. A novel finding was that distinct native depth-dependent fiber modulus properties were modulated to nearly homogeneous values by TGF-β1 and IGF-1 treatments, with modulated values strongly dependent on treatment.
Keywords: articular cartilage, collagen, fiber, distribution, anisotropic, IGF-1, TGF-β1, qPLM
Introduction
In vitro culture with transforming growth factor–beta 1 (TGF-β1) and insulin-like growth factor–1 (IGF-1) regulate articular cartilage metabolism and mechanical properties. Both TGF-β1 and IGF-1 stimulate collagen (COL) and glycosaminoglycan (GAG) synthesis in bovine articular cartilage samples while producing differential effects on tissue size and mechanical properties. TGF-β1 maintains tissue size accompanied by a maintenance or increase in tensile and compressive moduli and a maintenance or decrease of compressive Poisson’s ratios (Morales and Hascall 1991; Asanbaeva et al. 2008a; Williams et al. 2010; Stender et al. 2011) while IGF-1 produces significant tissue expansion at the expense of reduced tensile and compressive moduli and increased compressive Poisson’s ratios (Schalkwijk et al. 1989; Sah et al. 1994; Ficklin et al. 2007; Asanbaeva et al. 2008a; Williams et al. 2010; Stender et al. 2011). Prior experimental and modeling studies have suggested that COL network properties, such as content and tensile modulus, are strong determinants of articular cartilage mechanical properties (Jurvelin et al. 1997; Williamson et al. 2001; Kiviranta et al. 2006; Ficklin et al. 2007; Williams et al. 2010). Thus, the goal of this study was to integrate experimental data including articular cartilage mechanical properties, biochemical contents including overall COL volume fraction, and microstructural measures of COL fiber distribution with a continuum mixture model to predict how COL fiber modulus changes in vitro with TGF-β1 and IGF-1 treatment.
Past articular cartilage modeling studies employing distinct stress constitutive equations for the COL fiber network generally fall into three classes. The first class of models uses a discrete number of fibers (Farquhar et al. 1990; Bursac et al. 2000; Klisch et al. 2008; Thomas et al. 2009; Pierce et al. 2009) and the second class of models employs structural fiber reinforced FEA (Soulhat et al. 1999; Li et al. 1999; Korhonen et al. 2003; Wilson et al. 2004; Wilson et al. 2005; Shirazi and Shirazi-Adl 2005; Li et al. 2005; Garcia and Cortes 2006); some of those models were essentially equivalent to numerical implementations of continuous distribution models described below. The third class of models implement continuum theories employing a continuous fiber distribution (Schwartz et al. 1994; Lei and Szeri 2006, 2007; Quinn and Morel 2007; Ateshian et al. 2009; Federico and Gasser 2010; Pierce et al. 2010). Although previous studies have estimated true COL fiber elastic modulus (Farquhar et al. 1990; Schwartz et al. 1994; Soulhat et al. 1999; Shirazi and Shirazi-Adl 2005; Lei and Szeri 2006; Quinn and Morel 2007), an objective of this paper to use a more comprehensive set of mechanical, biochemical, and microstructural measurements from the same tissue source (i.e. species, age, anatomical location, and depth from articular surface).
The hypothesis of the current study was that a continuum mixture approach with a continuous COL fiber volume fraction distribution would predict that true COL fiber elastic modulus changes in a differential manner with in vitro treatment with TGF-β1 and IGF-1. To address the hypothesis, the aims were to (1) integrate biochemical and microstructural data into a mixture model with a continuous COL fiber volume fraction distribution and (2) use that model with comprehensive mechanical, biochemical, and microstructural data from the same tissue source to predict how true COL fiber elastic modulus changes in vitro with TGF-β1 and IGF-1 treatment.
Methods
Preliminaries
The continuity equation may be expressed as
| (1) |
where ρ and ρ0 are the densities in the current and reference configurations, respectively, and J = det(F) is the determinant of the deformation gradient tensor F. The right Cauchy-Green deformation tensor C is
| (2) |
and the Lagrangian strain tensor E is
| (3) |
For a Green-elastic material, there exists a strain energy density (per unit volume) function W(C) such that the second Piola-Kirchhoff stress tensor S is
| (4) |
and the material elasticity tensor ℂ is
| (5) |
The Kirchhoff stress tensor τ, Cauchy stress tensor T, and S are related by
| (6) |
Mixture model configurations
Because only equilibrium mechanical properties were considered, the effects of fluid-dependent and intrinsic viscoelasticity were neglected and fluid pore pressure was assumed to vanish at equilibrium. Thus, the elastic SM was the focus of modeling efforts. However, it is emphasized that experimentally measured changes in water content are indirectly modeled as they affect experimental measures of COL and GAG contents used in equations presented below for each experimental group.
Since only equilibrium configurations were considered, focus is on the articular cartilage solid matrix (SM). The SM was modeled as a mixture of three Green-elastic materials: COL, GAG, and other matrix (MAT) constituents. Strain energy density functions WCOL, WGAG, and WMAT were defined relative to initial configurations , and , respectively (Figure 1). Each of these configurations are identical to the SM reference configuration κR. An immobility constraint was assumed such that all COL, GAG, and MAT molecules are bound to the SM, and therefore each constituent’s deformation gradient tensor (FCOL, FGAG, and FMAT, respectively) is equal to the SM deformation gradient tensor F; i.e.,
Figure 1.
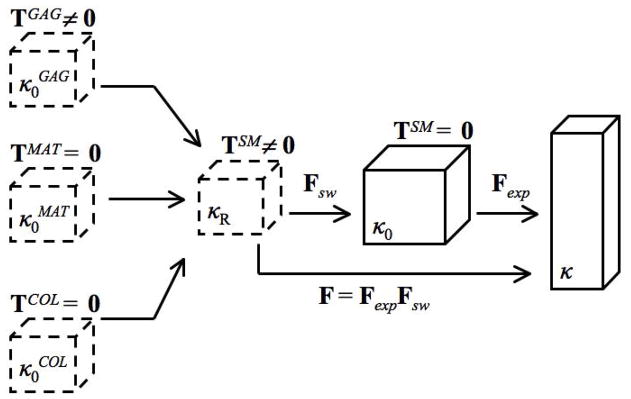
Schematic describing model configurations and kinematics. The glycosaminoglycan (GAG), other matrix (MAT), and collagen (COL) reference configurations , and , respectively, are identical to the solid matrix (SM) reference configuration κR. Due to the GAG swelling pressure, both the GAG and SM stresses TGAG and TSM are not zero in κR. Consequently, a swelling deformation gradient tensor Fsw maps κR to a stress-free SM configuration κ0. Mechanical testing was simulated by prescribing the experimental deformation gradient tensor Fexp that maps κ0 to the deformed equilibrium configuration κ.
| (7) |
A stress balance was hypothesized such that SM stress is
| (8) |
A stress-free SM reference configuration κ0 serves as the reference configuration for mechanical testing. Due to the GAG swelling pressure that is induced by the fixed negative charge density of GAG molecules, TGAG is a negative spherical stress tensor in κR. However, both TCOL and TMAT were defined to be zero tensors in κR. Consequently, via (8) TSM ≠ 0 so κR is not a stress-free SM reference configuration. Thus, all constituents experience an identical GAG-induced swelling deformation gradient tensor, Fsw, that maps κR to a stress-free SM reference configuration κ0. These initial deformations lead to a tensile pre-stress in the COL and MAT constituents in κ0 as in our previous studies (Klisch et al. 2008; Thomas et al. 2009).
The experimental deformation gradient tensor Fexp, that maps κ0 to the deformed configuration κ, simulates mechanical testing. Thus, the total SM deformation gradient tensor F relative to κR is defined via
| (9) |
Constituent strain energy and stress equations
Collagen model
The COL fiber distribution model was based on (Shirazi et al. 2011). A local spherical coordinate system (R, Θ, Φ) was used to parameterize a unit sphere of volume V=4π/3 at each tissue material point in (Figure 2). In theory, the unit sphere is interpreted as an infinitesimal sphere with uniform fiber properties (i.e. geometry, density, alignment); however, in application the unit sphere is treated as a finite sphere of sufficiently small volume to support the assumption of uniform fiber properties. The total fiber volume fraction φf in the unit sphere is
Figure 2.
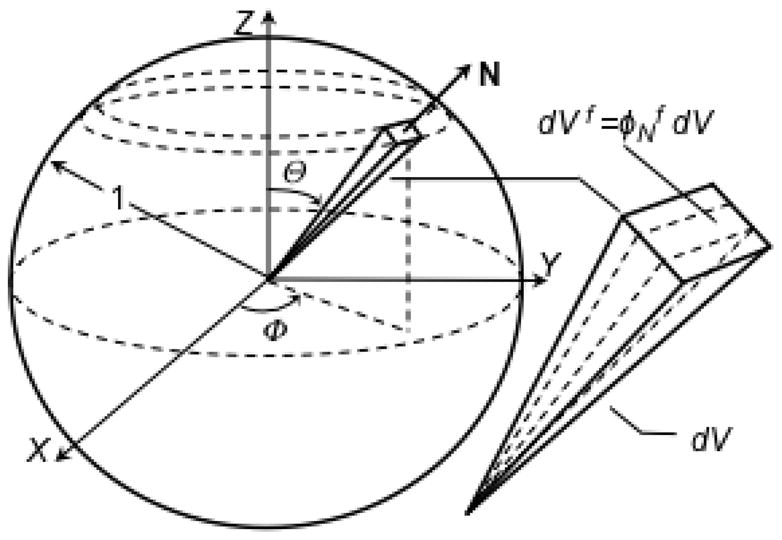
The unit sphere representation of the collagen fiber volume fraction distribution. Each differential pyramidal element is defined by a unit vector N and differential volume dV = (1/3) sinΘdΘdΦ. The directional fiber volume fraction in direction N is where dVf is the fiber volume in dV.
| (10) |
where Vf is the fiber volume in the unit sphere. A differential pyramid element is defined by a unit vector N and oriented in the range ([0, 1], [Θ, Θ+dΘ], [Φ, Φ+dΦ])] with apex at the unit sphere center and base corresponding to a differential area element on the sphere surface; its differential volume is dV = (1/3)sinΘdΘdΦ. The directional fiber volume fraction in direction N is
| (11) |
where dVf is the fiber volume in dV; represent only those fibers that pass through the sphere center and that lie in dV. Integrating (11) over the unit sphere, one obtains
| (12) |
The COL fiber strain in direction N is
| (13) |
where (·) is the dot product and E is defined using (2)–(3) with F from (9). The true fiber strain energy Ψf = Ψ̂f (EN) (per dVf) is a function of EN. The total COL strain energy WCOL (per V) is obtained by integrating the apparent fibril strain energy (per pyramidal volume dV) over the unit sphere volume V,
| (14) |
where Ĥ(EN) is the Heaviside step function of EN which only activates fibers in tension (i.e. EN>0). Since the immature tissue exhibited nearly linear stress-strain relations, Ψf was assumed to be a quadratic function of strain; i.e.,
| (15) |
where Ef is the true COL fiber modulus. Using (15), V=4π/3, and dV = (1/ 3)sinΘdΘdΦ, (14) becomes
| (16) |
Using (3) and (13) to express EN as a function of C, and the chain rule in the form
| (17) |
the COL second Piola-Kirchhoff stress was derived using (4) as
| (18) |
where ⊗ denotes the tensor product. Consequently, TCOL was derived using (6).
Glycosaminoglycan model
The GAG model was based on swelling pressure predictions using the Poisson-Boltzmann (PB) cell model reported previously (Buschmann and Grodzinsky 1995). In that study, GAG solutions were modeled at the microstructural level where the PB cell equation was solved for a unit cell containing a charged cylindrical GAG molecule in a surrounding medium of mobile ions. At low GAG densities (typical of the immature tissue studied here), the PB cell model more accurately predicts equilibrium compressive modulus that the ideal Donnan model (Buschmann and Grodzinsky 1995). In the current study, the PB cell model predictions were fit with the GAG strain energy function
| (19) |
where α1 and α2 are GAG material constants. Using (1), (4), and (6) for the GAG constituent, the GAG Cauchy stress is
| (20) |
Matrix model
The other matrix material (MAT) is intended to account for the mechanical response of other SM components not already attributed to COL and GAG, including other proteins, chondrocytes, and possible COL-GAG interactions on shear properties (Jin and Grodzinsky 2001) not explicitly modeled by the COL and GAG models. Here, an isotropic compressible Neo-Hookean material was used, similar to our previous studies (Klisch 2007; Thomas et al. 2009):
| (21) |
where μ is the MAT shear modulus and ln(−) is the natural logarithm function. Using (4), the MAT second Piola-Kirchhoff stress is
| (22) |
Polyconvexity
To ensure material stability and enhance numerical convergence, the total SM strain energy function WSM= WCOL + WGAG + WMAT was subject to the condition of polyconvexity (Ball 1976). Here, it suffices to establish that WCOL, WGAG, and WMAT are convex functions of F, J, and F, respectively (Schroder and Neff 2003). These conditions are met if Ef is positive (Shirazi et al. 2011), α1 and α2 are positive (this is easily shown), and μ is positive (Itskov and Aksel 2004).
Experimental data
Previous experimental data
Mechanical and biochemical properties before (D0 i.e. day zero) and after 12 days of in vitro treatment with TGF-β1 or IGF-1 were available from previous studies; please see (Williams et al. 2010) and (Stender et al. 2011) for full results. Articular cartilage blocks were harvested from the patellofemoral grooves and their adjacent ridges of newborn (1–3 weeks) bovine knees. D0 blocks were frozen for later testing. Two samples, a superficial-zone (S) slice with intact articular surface (~0.8 mm thick) and underlying middle-zone (M) slice (~0.6 mm thick), were microtomed from each block and cultured for 12 days in medium supplemented with 10 ng/ml TGF-β1 or 50 ng/ml IGF-1. Upon culture termination samples were measured for geometry and wet weights (WW) and frozen for later testing. Following thawing, some samples were punched into discs for sequential confined compression (CC) and unconfined compression (UCC) testing and other samples were punched into strips for uniaxial tension (UT) testing in the anterior-posterior direction. Mechanical properties used in the current study were equilibrium CC modulus (HA), UCC modulus (EC), and UCC Poisson’s ratios (ν; measured in two orthogonal directions) at 15% and 30% compressive strains, and UT modulus (ET) at 5% and 10% tensile strains. Each modulus value was represented as secant modulus (i.e. total stress/total strain) to account for a possibly nonlinear response. Following mechanical testing, samples were analyzed for water, COL, and GAG contents.
Analysis of previous experimental data
For the current study, analysis of variance (ANOVA) was used to determine the effects of strain level and layer on each mechanical property. Additionally, ANOVA was performed to determine the effect of direction on UCC Poisson’s ratios. For all groups, mechanical properties did not depend on strain level (p > 0.05); thus all mechanical properties were averaged across strain levels and experiments were simulated at average strain levels (i.e. 22.5% and 7.5% strains in UCC/CC and UT, respectively). Preliminary analyses established that the model describes the assumed linear mechanical response well, possibly due to the linear fiber stress-strain law and the tissue’s relatively low GAG density. Furthermore, UCC Poisson’s ratios did not depend on direction (p > 0.05); consequently, the orthogonal Poisson’s ratios were averaged for each specimen.
All UCC/CC samples and all D0 UT samples were obtained from the ridges adjacent to the patellofemoral groove, but data for cultured UT samples were only available from the groove. However, data for D0 UT samples were also available from the groove. Thus, for each layer a conversion ratio was calculated by diving D0 ET values from the ridge group by D0 ET values from the groove group. Consequently, TGF and IGF ET values from the groove groups were multiplied by these conversion ratios to estimate ET values for the ridge groups, using the assumption that TGF and IGF modulate tensile properties in a similar manner between the adjacent groove and ridge locations. These conversion ratios were 0.47 and 0.41 for S and M layers, respectively.
The resulting set of mechanical and biochemical properties used for each experimental group are listed in Tables 1 and 2.
Table 1.
Experimental values of water content (WAT; normalized by total tissue mass), glycosaminoglycan (GAG) density ( ; normalized by total tissue volume), and collagen fiber volume fraction (φf; normalized by total tissue volume). Groups correspond to superficial (S) and middle (M) layers untreated (D0) or cultured in vitro with TGF-β1 (TGF) or IGF-1 (IGF). Experimental values from Williams et al. (2010) shown as mean ± 1 standard deviation; n=7–15 per group.
| Group | WAT (%) | (mg/ml) | φf (%) |
|---|---|---|---|
| S-D0 | 89.3 ± 2.6 | 32.8 ± 7.5 | 3.9 ± 1.0 |
| M-D0 | 86.6 ± 2.8 | 47.6 ± 12.1 | 5.0 ± 1.4 |
| S-TGF | 85.7 ± 1.2 | 41.8 ± 6.9 | 5.4 ± 1.1 |
| M-TGF | 84.5 ± 3.0 | 51.3 ± 12.8 | 5.8 ± 1.6 |
| S-IGF | 89.0 ± 2.9 | 30.5 ± 4.3 | 3.3 ± 1.0 |
| M-IGF | 89.6 ± 4.9 | 33.0 ± 9.2 | 4.0 ± 2.1 |
Table 2.
Optimization results: unconfined compression Poisson’s ratio ν. Groups correspond to superficial (S) and middle (M) layers with untreated (D0) or cultured in vitro with TGF-β1 (TGF) or IGF-1 (IGF). Experimental values from Williams et al. (2010) and Stender et al. (2011) shown as mean ± 1 standard deviation; n=7–15 per group. All predicted values were within ± 1 standard deviation of mean experimental values.
| Group | ν | |
|---|---|---|
| S-D0 | experimental | 0.08±0.04 |
| predicted | 0.07 | |
| M-D0 | experimental | 0.12±0.08 |
| predicted | 0.06 | |
| S-TGF | experimental | 0.07±0.06 |
| predicted | 0.06 | |
| M-TGF | experimental | 0.06±0.02 |
| predicted | 0.07 | |
| S-IGF | experimental | 0.19±0.19 |
| predicted | 0.22 | |
| M-IGF | experimental | 0.26±0.15 |
| predicted | 0.20 |
qPLM experiments
Although the experimental samples were not analyzed with qPLM, additional samples were available to estimate the COL fiber distribution. Methods included those recently developed in our laboratory (Raub et al. 2011; Raub CB 2012 (in revision); Raub et al. 2012b; Raub et al. 2012a), supplemented with our cell-masking technique (Nguyen et al. 2012) to account for high cellularity of immature tissue (Jadin et al. 2005). In particular, qPLM was used to analyze ~1 mm thick (~0.5–1.5 mm below the articular surface) samples (n=4) from the ridges adjacent to the patellofemoral groove of newborn bovine knees that were incubated for 4 days in medium supplemented with 20% FBS. This data was used to define a single, equivalent anisotropic distribution for all groups (see the Discussion).
qPLM colormaps of parallelism index (PI i.e. an optical measure describing the parallel organization of birefringent molecules within a pixel, ranging from 0 (random alignment) to 1 (complete alignment)) and orientation angle (α i.e. the average alignment of birefringent molecules within a pixel) were created as follows. Cartilage blocks were fixed in 4% paraformaldehyde for 48 hours at 4 °C. Sagittal cryosections 10 μm thick were adhered to microscope slides and allowed to dry overnight at room temperature. Unstained sections were rehydrated and imaged using a polarized light microscope (Polam 213-TE, Lomo America, Northbrook, IL, USA). A 100W halogen light source was passed through a green interference filter (549 nm) to create monochromatic light incident upon the sample, while a polarizer, analyzer and quarter-wave plate were placed in the light path during image acquisition to determine qPLM parameters. Birefringence signal was collected with a 10×, 0.2 numerical aperture objective (optical resolution 1.7 μm/pixel) and captured by a camera (GO-21, QImaging, Surrey, Canada) attached to the microscope. Images were acquired with QCapture (QImaging) and processed in Matlab (Mathworks, Natick, MA, USA) using custom-designed routines to generate and quantify qPLM parameter colormaps.
Image acquisition and image parameter calculations were based on published methods (Rieppo et al. 2008). Raw images were collected for polarizer-analyzer positions of 0–90 deg. through 90–180 deg., every 15 deg. Additionally two images were taken with quarter-wave plate inserted at polarizer-analyzer positions of 45–134 deg. and 45–136 deg., and one background image was recorded with sample and wave-plate removed and polarizer-analyzer at 45–135 deg. PI and α were determined from a least-squares fit of pixel intensity data to the Fresnel equation (Rieppo et al. 2008). The relative intensity of pixels from images with the quarter-wave plate inserted was used to distinguish between orthogonal fast and slow axes of polarization, therefore assigning either a more horizontal (<45 deg.) or more vertical (>45 deg.) orientation of birefringent material to the pixel. Calculations from pixel intensity data created PI and α colormaps for each field of view. Two overlapping fields of view were stitched together using a custom code, with the overlap region a linear combination of the co-registered pixels, and individual weighting coefficients decreasing with increasing distance from the edge of the overlap region.
Finally, tiled PI and α colormaps of the entire tissue section were segmented to exclude low-signal regions of the cartilage, corresponding to chondrocyte lacunae. An image mask was created using a previously developed code (Chan et al. 2012 (accepted)) that fit the maximum birefringence pixel histogram to three Gaussian curves, representing background (least intense) and signal (more intense), and then setting an image threshold level as the background mean plus two standard deviations. This masking procedure was found to remove a large portion of background signal as well as some dim birefringence signal, which is recommended to reduce systematic error in qPLM parameter averages from masked regions (Rieppo et al. 2008). Matrix-containing pixels were identified from the mask image and used to quantify the qPLM parameters.
Regions of interest were obtained by dividing tissue sections into 30 micron wide by 1 pixel (i.e. 1.7 μm) deep layers; α and PI averages for these regions of interest (51 μm2) were then used to obtain global averages and standard deviations. In addition to global quantification, tissue depth was measured from the articular surface, adjacent top, middle, and bottom sections of 1/3 total height were created, and qPLM parameters were quantified from these sections to statistically justify the modeling assumption of homogeneous fiber distribution.
Parameter estimation
GAG elastic parameters
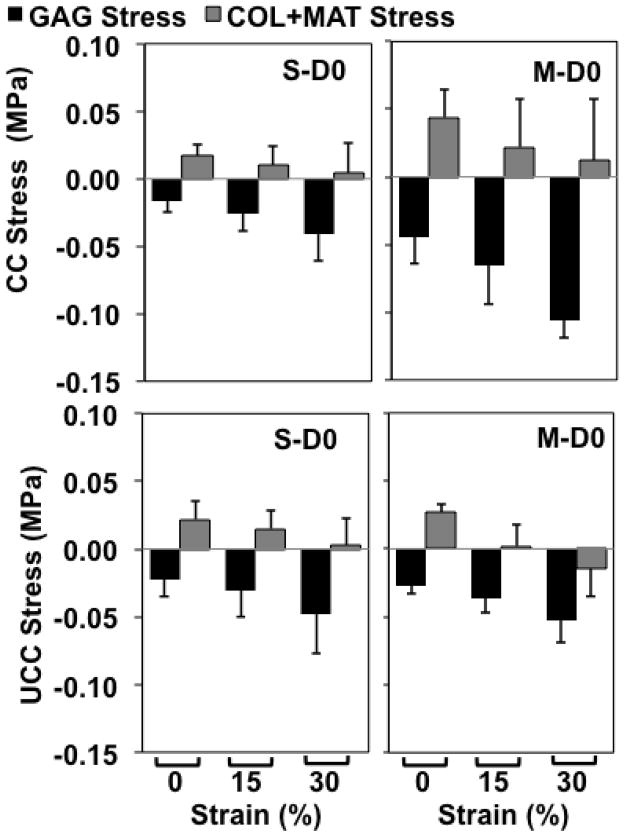
The PB cell model (Buschmann and Grodzinsky 1995) requires, as input microstructural parameters, the radius of a GAG chain (a) and the intercharge distance between adjacent GAG chains (b). In (Buschmann and Grodzinsky 1995), values a=0.55 nm and b=0.64 nm were proposed to best fit swelling pressure data of (Williams and Comper 1990); however, model predictions were also provided for other estimates of a and b ((Buschmann and Grodzinsky 1995)). In the current study, it was assumed that COL+MAT tensile stress should monotonically decrease with applied compressive strains. This is justified due to the stress-softening phenomenon reported for articular cartilage in compression (Chahine et al. 2004; Ficklin et al. 2007; Williams et al. 2010). More specifically, if z is the direction of applied loading, then the combined COL+MAT normal stress should monotonically decrease during compression. That stress component was calculated using (8) as
| (23) |
where was the experimental equilibrium SM stress and was the predicted GAG model stress. In a preliminary study, values a=0.55 nm and b=0.64 nm provided compressive GAG stresses that were higher (i.e. more negative) than experimental compressive tissue stresses, resulting in increasing (i.e. higher tensile) values of COL+MAT stresses with increasing compression as calculated from (23). Consequently, all PB cell model predictions based on various values of a and b were considered.
COL fiber distribution
The fiber volume fraction distribution was estimated from planar qPLM images. The intersection of the unit sphere with a plane defined by Φ = Φ0 is a unit circle (Figure 3). Consequently, in the plane defined by Φ = Φ0 we considered the unit circle containing all coplanar fibers passing through the center. The fiber distribution was assumed independent of Φ based on earlier results for this tissue source that tensile modulus and UCC Poisson’s ratios, both properties that are thought to depend on COL network properties, do not depend on direction in the plane parallel to the surface (Williamson et al. 2003; Williams et al. 2010). A differential triangle element dA in the unit circle bisects a corresponding differential pyramid element dV in direction N; its differential area is dA = (1/2)dΘ. The directional fiber area fraction in direction N is
Figure 3.
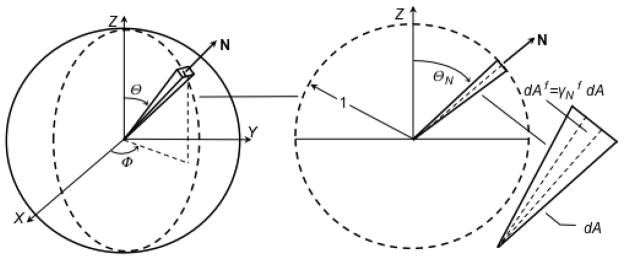
The unit circle representation of the collagen fiber area fraction distribution used for analyzing planar qPLM images. Each differential triangle element is defined by a unit vector N and differential area dA = (1/2)dΘ. The directional fiber area fraction in direction N is where dAf is the fiber area in dA. The qPLM data was used to estimate and Delesse’s principle was assumed, i.e. , to determine .
| (24) |
where dAf is the fiber area in dA. Thus, the total fiber area Af in the unit circle is
| (25) |
The fiber area fraction in direction N is dAf normalized by Af; using (24) and (25) one obtains
| (26) |
which is subject to the constraint
| (27) |
Assuming that Delesse’s principle (Delesse 1847) is valid for these differential elements, the directional fiber area and volume fractions are equal, i.e.
| (28) |
qPLM data was used to estimate the area fraction of fibers in a finite triangle element oriented in mean direction ΘN with range ΔΘN and area
| (29) |
where the symbol Δ defines a finite quantity. In the FEA, the unit sphere was discretized into 3200 pyramid elements (ΔΘ=4.5, ΔΦ =4.5 deg.). All finite triangle elements were assumed homogeneous. The unit semi-circle with ΘN ranging from 0 to +π deg. was discretized into a total of m=40 elements. For finite sized elements (26) and (27) become, using (28),
| (30) |
and
| (31) |
Since neither PI nor α varied with axial depth (see Results), a global α distribution was obtained, upon averaging histogram results for each specimen (n=4), which was then assumed to be uniform in the specimens. In particular, a normalized frequency density plot was constructed by calculating the frequency of α observations/total observations/interval width, for each interval width Δθ = 10 deg. The normalized frequency density plot was assumed to represent fiber area fraction densities for each finite triangle element. This distribution was modified to account for the fact that PI values were not equal to unity, and to improve FEA convergence properties (see Discussion). Thus, the fiber area fraction density distribution was modeled as a Gaussian distribution DG superposed with a background isotropic distribution DISO,
| (32) |
where C is a scalar constant needed to enforce constraint (31), and normalizing by Δθ allows comparison between distributions with different interval widths. DG was modeled, similar to previous work (Lei and Szeri 2006), using a normalized Gaussian distribution function
| (33) |
where αavg and σ are the global average and variance of all pixel α values. DISO was modeled using
| (34) |
where λ is the fiber area fraction density of the background isotropic distribution. The scalar constant C of (32) must be solved for numerically because DG and DISO are coupled. In this study, λ was estimated from the qPLM results as discussed in the Results section.
Using (32)–(34) in (30) yields a system of m equations with m+1 unknowns: m unknowns and . To resolve this indeterminacy, the system of m equations is supplemented with the constraint equation (12), which for finite sized elements becomes
| (35) |
where V=4π/3 and ΔVN = (1/3)sinΘNΔΘNΔΦN have been used, the distribution has been assumed independent of Φ so that ΣV ΔΦN = 2π. Since the total fiber volume fraction φf is measured experimentally, (35) supplies an additional equation without introducing an additional unknown.
COL and MAT elastic parameters
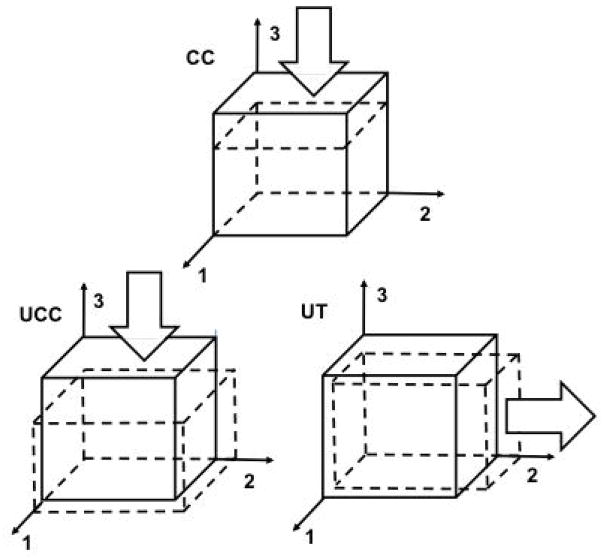
Consequently, the only remaining adjustable parameters were true COL fiber modulus Ef and MAT shear modulus μ, which were determined using FEA of the experiments. The total SM Cauchy stress (see Eqn. (8)) and Jacobian stiffness matrix (see Appendix) were implemented for use with the Abaqus solver (Simulia) using a user-defined material (UMAT) subroutine. Single C3D8 eight node, full integration, linear brick finite elements were used with static displacement boundary conditions for CC, UCC, and UT experiments (Figure 4). The use of single finite elements was appropriate because samples were relatively thin and homogeneity was assumed. The COL distribution function was implemented in the UMAT using 3200 pyramidal elements of equal volume; a convergence study with 12800 pyramidal elements revealed a difference of less than 0.1% in computed tissue stresses. Ef and μ were predicted using an optimization to UT and UCC axial stresses only; model predictions were then compared to UCC Poisson’s ratios and CC moduli for validation. The optimization script was coded in Python (Python Software Foundation) to vary Ef and μ and minimizing the objective function
Figure 4.
Displacement boundary conditions for confined compression (CC), unconfined compression (UCC), and uniaxial tension (UT) FEAs. Due to model assumptions (see text), a single element is used with static boundary conditions. The articular surface is defined with outward normal in the +3 direction (i.e. the top surface). Arrows show directions of applied displacements on surfaces with outward normal in the +3, +3, and +2 directions for CC, UCC, and UT, respectively. Reference and deformed configurations are shown as solid and dashed lines, respectively. For CC, surfaces with outward normals in the ±1, ±2, and +3 directions are constrained in the 1 and 2 directions, and surface with outward normal in the −3 direction is constrained in all directions. For UCC and UT, surfaces with outward normals in the −1, −2, and −3 directions are constrained in the 1, 2, and 3 directions, respectively.
| (36) |
where T and C subscripts represent tensile and compressive stresses at 7.5% and 22.5% tensile and compressive strains, respectively, FEA and exp subscripts represent predicted and experimental values, respectively, and compressive stresses were weighted by a factor of 10 because their values were ~ 1 order of magnitude less than tensile stresses. Ef and μ were constrained to be positive; a lower bound of 0.001 MPa was used for μ since pilot simulations revealed that a positive μ value was needed for model convergence.
Results
GAG elastic parameters
In order to predict monotonically decreasing COL+MAT stresses during compression, PB cell model predictions with a = 0.55 nm and b = 0.51 nm were used. To provide a good fit to those PB cell model predictions, GAG swelling pressure (πGAG) and, consequently, Cauchy stress equations were chosen as
| (37) |
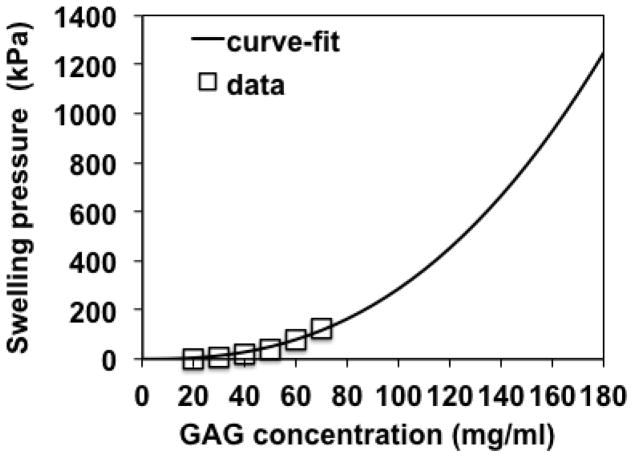
with units of kPa for πGAG, mg/ml for ρGAG, and MPa for TGAG. Thus, the material constants of Eqn. (20) were α1 = 2.87 (MPa-ml2.5/mg2.5) and α2 = 2.5 (dimensionless). Eqn. (37) fits PB cell model predictions with a = 0.55 nm and b = 0.51 nm reported in (Buschmann and Grodzinsky 1995) with an R2 value of 0.98 (Figure 5) while predicting monotonically decreasing values of for the D0 CC and UCC experiments (Figure 6).
Figure 5.
Curve-fit results of GAG swelling pressure vs. GAG concentration. Data points = Poisson-Boltzmann model predictions with GAG radii of 0.55 nm and intercharge distance of 0.51 nm reported in Figure 4 of (Buschmann and Grodzinsky 1995). Solid curve = curve-fit of πGAG = 0.00287(cGAG)2.5 (R2=0.98) where πGAG and cGAG are GAG swelling pressure (kPa) and GAG concentration (mg/ml), respectively. Range of GAG concentrations includes maximum values of cGAG corresponding to maximum compressive strains used in the current study.
Figure 6.
Predicted values of and combined normal stresses in the direction of applied loading for confined (CC) and unconfined (UCC) compression tests. Groups correspond to superficial (S) and middle (M) layers untreated (D0). Predicted values shown as mean ± 1 standard deviation; n=7–15 per group. Vertical axis range is uniform for ease of comparison.
COL fiber distribution
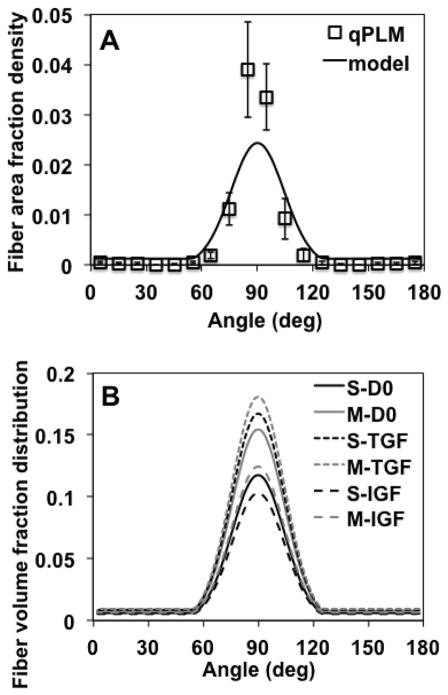
COL fiber distributions were highly anisotropic for each specimen as quantified by qPLM (Figures 7–9A). Neither PI nor α values varied between the 1/3 tissue sections (ANOVA, p=0.54, 0.98 respectively) (Figure 8). The parameters αavg, σ, and λ in the fiber distribution function (32)-(34) were chosen as follows. The global average (αavg) and standard deviation (σ2) of α values, average among the 4 specimens, were 89.4±14.4 deg. For convenience, we used αavg =Θ0 = 90 deg. while calculating σ =(14.4 deg)0.5=3.8 deg0.5. To determine the background isotropic distribution parameter λ, first we defined upper and lower bounds as follows. The fiber area fraction density, estimated from qPLM (Figure 9A), suggested that ~7% belonged to a background isotropic distribution, a value estimated as extending the % of pixel α values measured outside the range 60 to 120 deg. to a background isotropic distribution. Thus, a lower bound was set to 7% of the total; however, due to the fact that PI values were not equal to 1.0 the background isotropic distribution likely exceeds this value. Thus, an upper bound for the background isotropic distribution was set to 1.0 minus the average PI value, i.e. 0.27 or 27% (Figure 8), based on the interpretation that the this value represents an upper bound on fibers that are randomly oriented. Then, in order to balance the needs of obtaining model convergence and producing accurate numerical predictions of the mechanical property data, which proved difficult for the IGF group (see Discussion), we set the background isotropic distribution to 23% of the total, corresponding to λ =0.00127 deg−1, producing the fiber area fraction density used in the FEA (Figure 9A). Since each of the experimental groups had different total collagen volume fractions, the collagen volume fraction distributions, calculated using (35), varied between groups (Figure 9B).
Figure 7.
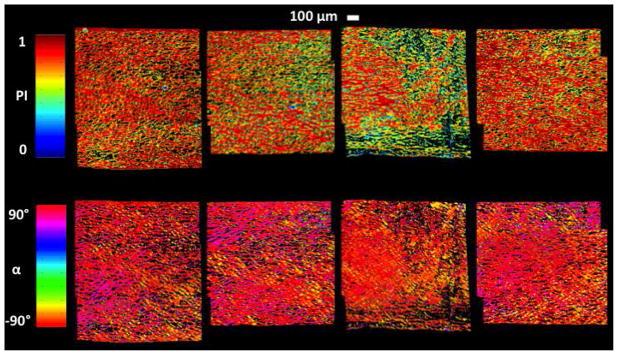
qPLM results for 1 mm thick specimens (~0.5–1.5 mm below the articular surface) incubated for 4 days in medium supplemented with 20% FBS. Colormaps shown for parallelism index (PI) and orientation angle (α) reveal a highly anisotropic collagen fiber distribution. Values of α = ±90° correspond to directions Θ = ±90° in the spherical coordinate system of Figures 2–3 and to the direction of applied tension; α values were transformed to the range 0 to 180 degrees for subsequent use.
Figure 9.
Collagen fiber distributions. (A-qPLM) qPLM results were averaged over n=4 specimens to construct a normalized frequency density plot; data points represent frequency of α observations/total observations/interval width Δθ =10 deg; mean ± 1 standard deviation values shown were calculated using mean values for each interval of n=4 specimens. (A-model) Fiber area fraction density plot used in FEA employing a Gaussian distribution superposed with a background isotropic distribution; the background isotropic distribution was increased to 23% of the total to account for PI values not equal to unity and to improve convergence properties of the FEA models. Curve is fit to data point representing fiber area fraction densities , (see text). (B) Collagen fiber volume fraction distribution functions calculated from the fiber area fraction distribution; note that these distributions differ because the collagen volume fraction differs between groups (Table 1). Groups correspond to superficial (S) and middle (M) layers untreated (D0) or cultured in vitro with TGF-β1 (TGF) or IGF-1 (IGF).
Figure 8.
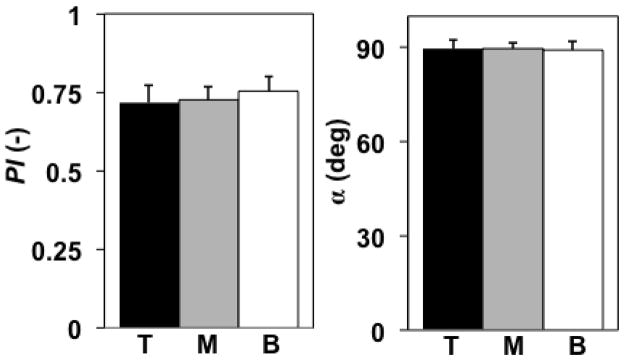
qPLM results (parallelism index PI, orientation angle α) averaged in the top (T), middle (M), and bottom (B) 1/3 tissue regions; mean ± 1 standard deviation values shown were calculated using mean values for each region of n=4 specimens. Neither PI nor α varied between 1/3 tissue regions (ANOVA, p=0.54, 0.98 respectively).
COL and MAT elastic parameters
For all D0 and TGF simulations, the optimized μ values corresponded to the lower bound set at 0.001 MPa. For S-IGF and M-IGF simulations, the optimized μ values were 0.031 and 0.043 MPa, respectively; however, those FEA models failed to converge for lower values of μ (see Discussion).
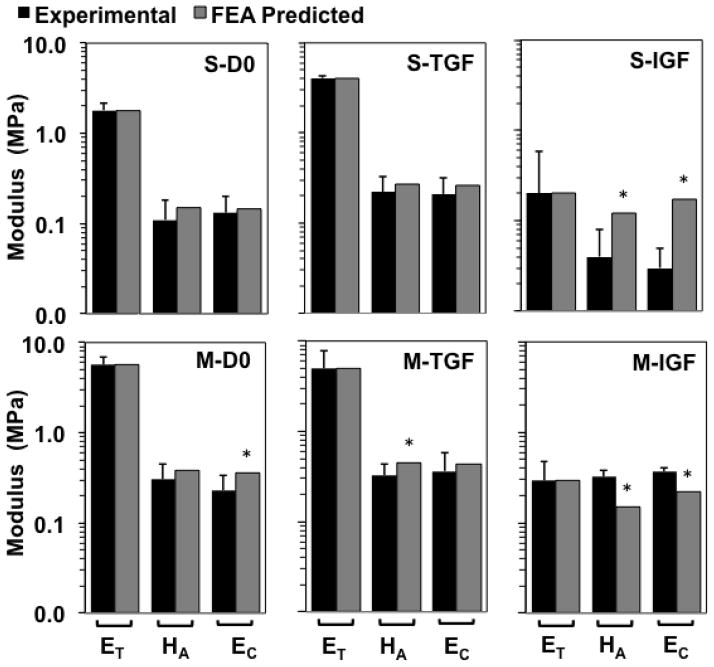
Ef predictions varied substantially among groups (Figure 10). For the S layer, predicted Ef values were 175, 281, and 22 MPa for D0, TGF, and IGF groups, respectively. For the M layer, predicted Ef values were 422, 309, and 26 MPa for D0, TGF, and IGF groups, respectively. Using those optimized values of Ef, predicted values of ET, HA, EC, and ν (Table 2, Figure 11) fell within a standard deviation of experimental means, with the following exceptions. For M-D0, the predicted EC exceeded the mean +1 standard deviation value by 6%. For M-TGF, the predicted HA exceeded the mean +1 standard deviation value by 5%. For S-IGF, the predicted HA and EC exceeded mean +1 standard deviation values by 50 and 240%, respectively. For M-IGF, the predicted HA and EC exceeded mean +1 standard deviation values by 7 and 262%, respectively.
Figure 10.
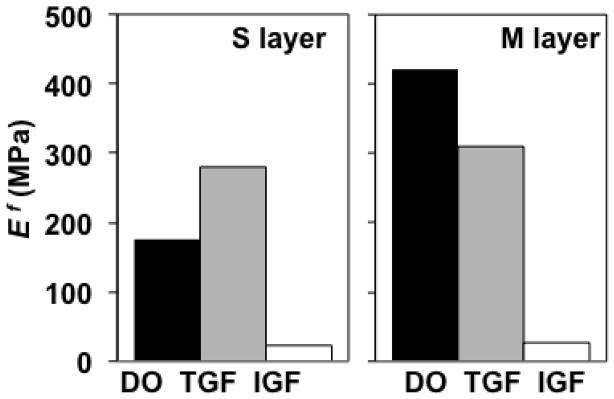
Optimization results: predictions of true collagen fiber modulus Ef. Groups correspond to superficial (S) and middle (M) layers untreated (D0) or cultured in vitro with TGF-β1 (TGF) or IGF-1 (IGF).
Figure 11.
Optimization results: comparison of experimental and predicted tensile modulus ET, confined compression modulus HA, and unconfined compression modulus EC. Groups correspond to superficial (S) and middle (M) layers untreated (D0) or cultured in vitro with TGF-β1 (TGF) or IGF-1 (IGF). Experimental values shown as mean ± 1 standard deviation; n=7–15 per group. * = predicted values not within ± 1 standard deviation of experimental means. Vertical logarithm scale (base 10) used due to the tension-compression asymmetry.
Discussion
The Ef predictions for D0 S and M samples were 175 and 422 MPa, respectively, representing a substantial difference of 247 MPa that reflects depth-dependence of native D0 mechanical properties (Table 2, Figure 11). However, in vitro treatment with TGF-β1 or IGF-1 were predicted to modulate Ef toward convergent values of 281–309 MPa or 22–26 MPa, respectively. Thus, an interesting and novel finding of the current study was that, for immature bovine articular cartilage samples with distinct native depth-dependent properties, both TGF-β1 and IGF-1 modulate COL fiber modulus in a convergent fashion. Further, since COL content (Table 1) was measured directly, the model allows for assessment of relative effects of Ef and φf on tissue modulus. Specifically, the results suggest that IGF treatment substantially decreases tissue tensile modulus (−89/−95% for S/M layers) primarily due to large decreases in Ef (−87%/−94% for S/M layers) with modest decreases in φf (−15%/−20% for S/M layers) as secondary factors; whereas TGF treatment changes tissue tensile modulus (+125%/−13% for S/M layers) due to more complex interactive changes in Ef (+61/−27% for S/M layers) and φf (+38%/+16% for S/M layers).
The current study refines the relationship between true and apparent COL network stresses by using a fiber volume fraction distribution function. The fiber distribution model used here is based on (Shirazi et al. 2011) and differs from many previous models because the distribution parameter is COL fiber volume fraction, a parameter often measured using biochemical assays, instead of a normalized number of COL fibers (Lanir 1978, 1983; Aspden 1986; Sacks 2003; Gasser et al. 2006; Lei and Szeri 2006; Ateshian 2007). In order for models based on a normalized number of COL fibers to become equivalent to our model, we propose that fiber diameters (and possibly their distribution) for different directions must be defined, so that the number of fibers times the fiber cross-sectional area yields the fiber area fraction on a subset of the unit sphere. Since volume fraction equals apparent density divided by true density, our formulation is essentially identical to one that uses an apparent density distribution (Kroon 2010).
The predicted true COL fiber modulus Ef of 175 and 422 MPa for D0 S and M layers, respectively, fell within a range of estimates of 70–643 MPa from previous studies (Farquhar et al. 1990; Schwartz et al. 1994; Soulhat et al. 1999; Shirazi and Shirazi-Adl 2005; Lei and Szeri 2006; Quinn and Morel 2007). In comparison to those previous studies, a novel feature of this study was that a comprehensive set of biochemical, mechanical, and microstructural property measurements for the same tissue source (i.e. species, age, joint location, and depth from the articular surface) was used to estimate model parameters: biochemical assays were used to determine COL volume fractions and GAG densities, qPLM was used to estimate COL fiber distribution, and compressive and tensile test data were used to estimate GAG swelling pressure and true COL fiber modulus Ef.
Interestingly, our qPLM analysis revealed a strongly anisotropic COL fiber orientation in a mostly horizontal (i.e. parallel to the surface) direction in the middle zone. Although this result appears to be novel for ~1–3 week old immature bovine articular cartilage, it agrees with recent results of a strongly anisotropic COL fiber orientation with small depth-variation in immature tissue from other species; e.g., horse (van Turnhout et al. 2008), pig (Rieppo et al. 2009), rabbit (Julkunen et al. 2010); and sheep (van Turnhout et al. 2010). The COL fiber structure remodels rapidly during development towards the depth-dependent structure of mature articular cartilage (Julkunen et al. 2009; van Turnhout et al. 2010), consisting of a superficial zone of high anisotropy and horizontal orientation, an isotropic middle zone, and an anisotropic, vertically-oriented deep zone. Due to these rapid developmental changes that occur in COL fiber structure, care must be taken when developing models and interpreting results for immature tissue; in particular, COL fiber structure should be quantified and appropriate models should be developed, as done here and in a recent study (van Turnhout et al. 2011).
For all groups, FEA model predictions of tissue tensile modulus ET were similar to experimental values; in particular, ET predictions varied from experimental means by 0.02–1.60%. However, predictions of tissue compressive properties HA, EC, and ν were not as accurate, possibly due to uncertainty in PB cell model parameters. Our preliminary studies with baseline PB cell model parameters a=0.55 nm and b=0.64 nm (Buschmann and Grodzinsky 1995) resulted in increasing (i.e. higher tensile) values of with increasing compressive strain. Consequently, the current study used different estimates of a and b from (Buschmann and Grodzinsky 1995). This discrepancy may be due to different GAG solutions used for estimating GAG osmotic swelling pressures; i.e. (Buschmann and Grodzinsky 1995) used Swarm rat chondrosarcoma PG solutions (Williams and Comper 1990) whereas the current study used bovine tissue. Also, calculated GAG densities of the compressed samples in the current study were substantially higher than those values from (Williams and Comper 1990). A future study should include better estimating GAG swelling pressures for this tissue source using a combination of experimental and modeling aims.
Predicted compressive properties for D0 and TGF groups were fairly accurate when one considers the standard deviations as measures of accuracy; except, as noted above, that predicted M-D0 EC and M-TGF HA exceeded the mean +1 standard deviation values by 5–6%. Predicted compressive properties for the IGF group were substantially less accurate. In addition to the uncertainty in the GAG stress equation discussed above, this finding may result from the fact that the IGF models failed to converge for lower values of μ, which would have resulted in lower predicted compressive moduli. Convergence difficulties for the IGF models may be attributed to excessively large elastic deformations in the axial direction due to a combination of relatively large decreases in fiber modulus and a strongly anisotropic fiber distribution that produces little resistance to GAG induced swelling in the axial direction. In recent studies we have found that IGF treatment induces excessive swelling in the axial direction with a significant decrease in mechanical integrity (Ficklin et al. 2007; Williams et al. 2010), as well as macroscopically observed changes in tissue structural integrity, suggesting that IGF treatment may cause the tissue to evolve into a material that can not be accurately modeled with the methods used in the current study.
A limitation of the current study is due to the uncertainty in the interpretation of the PI value in the context of a fiber distribution model. Indeed, a previous study discussed how different collagen microstructures may produce similar qPLM results, and also incorporated a background isotropic distribution in their interpretation of qPLM parameters (Van Turnhout et al. 2009). In this study, the fiber area fraction of the background isotropic distribution was set above a lower bound of 7%, as determined directly from the qPLM data, due to the fact that PI values were not equal to 1.0. Due to uncertainty in the interpretation of the PI value, an upper bound was set to 1.0 minus the average PI value, i.e. 0.27 or 27%. Pilot studies revealed, first, that mechanical property predictions were most accurate for all groups when the lowest values of μ were used and, second, that model convergence could be achieved for lower values of μ when the background isotropic distribution was increased. Thus, we set the background isotropic distribution at a relatively high value (i.e. 23%) in the range between the lower and upper bounds in order to improve mechanical property predictions. It is possible that selective use of other techniques, such as scanning electron microscopy or multiphoton analysis (Lilledahl et al. 2011), may help in resolving this limitation in future studies.
A second limitation of the current study was that tension data following treatment (from the groove) were not obtained for the same location as compression and qPLM data (from the adjacent ridge) following treatment. However, D0 tension data were available for both locations, allowing the use of a scaling procedure. Since the effects of both TGF and IGF treatments in this and previous studies were substantial, it is likely that the predicted changes in true COL fiber modulus would be qualitatively similar if all samples were harvested from the same location.
A third limitation was that qPLM measurements were only available for 1 type of treatment (4 days in medium supplemented with 20% FBS), which necessitated the assumption that COL fiber distribution did not change during culture. Since the COL fiber distribution was highly anisotropic, it is unlikely that a more anisotropic distribution would have affected model predictions substantially. However, it is possible that 12 days of treatment may shift the COL fiber distribution towards isotropy. To address this issue, we performed pilot simulations with an isotropic fiber distribution for all groups; Ef predictions were 290, 480, 28, 710, 490, and 34 MPa for S-D0, S-TGF, S-IGF, M-D0, M-TGF, M-IGF groups, respectively. Thus, although Ef predictions were higher for all groups, they still trended toward convergent values for TGF and IGF groups, supporting our main conclusion regarding the effects of TGF and IGF on collagen fiber modulus.
Regardless, our experimental data suggest that the highly anisotropic COL fiber distribution was maintained during culture. Experimental TGF group thicknesses increased by 3% while width/length increased by 2%/1%, respectively, values that were not significantly different than zero (Williams et al. 2010) and that are consistent with maintenance of the anisotropic fiber distribution coupled with modest changes (+61/−27% for S/M layers) in fiber modulus and low GAG swelling pressures. Furthermore, experimental TGF group UCC Poisson’s ratios trended to lower values than D0 group values, consistent with maintenance of the anisotropic fiber distribution as previous studies suggested that COL network properties are strong determinants of UCC Poisson’s ratios (Kiviranta et al. 2006; Ficklin et al. 2007). On the other hand, experimental IGF specimen thicknesses increased by 71% while width/length increased by 6%/2%, respectively. Those values are consistent with maintenance of the anisotropic fiber distribution, that would offer little COL network resistance to expansion in the thickness direction, coupled with substantial reductions in fiber modulus (−87/− 94% for S/M layers), thereby enhancing expansion in the direction of least COL network resistance.
As mentioned in the Methods section, cell masking of the qPLM data was used to separate the low intensity birefringence signal and background from chondrocytes from matrix-originating birefringence for accurate matrix structural quantification (Rieppo et al. 2008). Cell masking of qPLM data has been demonstrated using a dynamic thresholding technique (Rieppo et al. 2008); however, this study employed a global thresholding technique based on the pixel histogram of the maximum gray-level birefringence signal, which can accurately segregate independent pixel distributions from background, cells, and anisotropic matrix. The 1.7 μm image resolution was sufficient to identify individual cells/lacunae to be removed by signal thresholding, because highly cellular tissue introduces error into qPLM parameter averages by combining optical signal from disparate regions (cells, lacunae, and matrix). By masking the birefringence signal to remove low signal areas associated with chondrocytes, the resultant segmented qPLM parameters were specific to the extracellular matrix of the immature cartilage explants. Though such a conservative method removed low birefringence regions from analysis, it preserved signal from anisotropic matrix regions.
A final limitation is the uncertainty regarding the interpretation of Ef. In the proposed model, Ef represents a true modulus of a continuous fiber-reinforcing network within a tissue that is subjected to several modeling assumptions (e.g. affine deformations, uniform swelling strains, linear fiber stress-strain relations). Other matrix constituents, such as water, ions, and GAGs, may affect Ef. For example, recent GAG depletion experiments for the tissue source used in the current study revealed that GAG depletion significantly affects tissue tensile modulus and relaxation properties; e.g., ~85% GAG depletion increased tissue tensile modulus by more than 100% and tissue tensile modulus was negatively correlated with GAG content (Asanbaeva et al. 2008b; Thomas et al. 2009). Also, recent nanomechanical studies revealed that predicted tensile modulus of hydrated COL microfibrils are approximately one order of magnitude lower than predicted values for both dry COL microfibrils and single COL molecules (Gautieri et al. 2011). Those results suggest that the manner in which COL molecules and fibers interact within the COL network and with other tissue components may strongly affect continuum level estimates of Ef. Currently, the mechanism for modulated COL fiber modulus remains unclear; the proposed model explicitly accounted for changes in GAG and COL contents while other measurements (e.g., collagen-specific pyridinoline and cell contents) for these protocols (Williams et al. 2010) provided no conclusive mechanism.
Regardless of the limitations mentioned above, the total tissue model was shown to be capable of modeling the substantial tension-compression asymmetry of articular cartilage as predicted tensile moduli were approximately an order of magnitude larger than predicted compressive moduli. The results suggest methods that may be used in future studies aimed at estimating COL fiber modulus changes during in vitro growth and remodeling protocols related to articular cartilage repair. In order to increase the accuracy of model predictions, key microstructural features such as GAG and COL contents and COL fiber distributions should be measured for the same samples that are mechanically tested. Furthermore, rigorous validation tests should be performed for continuum-based models, not only to provide validation for some problems but also to highlight the models’ limitations for other problems (e.g. some compression analyses presented here) for the sake of advancing science.
Acknowledgments
This work was supported by the National Institutes of Health (SJH, RLS, SMK), the National Science Foundation (RLS, SMK), a National Science Foundation Graduate Research Fellowship (KY), a National Institutes of Health Postdoctoral Fellowship (CBR), and the Donald E. Bently Center for Engineering Innovation (SMK). The authors thank Daniel Crawford and Nathan Balcom (Biomedical Engineering Department, California Polytechnic State University) for assistance in qPLM analysis.
Appendix
In this appendix, details of the SM tangent stiffness matrix required in the UMAT by Abaqus are presented. This stiffness matrix relates the stress increment to the strain increment. Here, the superscript SM is omitted when referring to SM quantities and indicial notation is used.
Abaqus requires the Jacobian defined through the variation of Kirchhoff stress τij as
| (38) |
where δJ (τij) is the Jaumann stress rate and Dij and Wij are the symmetric and skew parts of the displacement increment gradient Lij
| (39) |
Recalling (6), the increment in Kirchhoff stress δτij is derived as
| (40) |
where the increment in the deformation gradient tensor δFiA is
| (41) |
Recalling (5), the elasticity tensor ℂABCD relates the increments in second Piola-Kirchhoff stress (δSAB) and Cauchy Green deformation tensors (δCCD) as
| (42) |
which, using (2), (39), and (41) leads to
| (43) |
Substituting (41) and (43) into (40) and recalling (6), a straightforward derivation leads to
| (44) |
Thus, comparison of (38) and (44) yields the definition of the tangent stiffness matrix required by Abaqus
| (45) |
For implementation with the model presented here, the tangent stiffness matrix defined by (45) was derived for each constituent, and these were summed to obtain the total SM tangent stiffness matrix. In addition to coding the constituent stress equations, the elasticity tensors were derived for each constituent using (5). These derivations are straightforward but lengthy, here only the final results are shown as follows:
| (46) |
| (47) |
| (48) |
References
- Asanbaeva A, Masuda K, Thonar EJ-MA, Klisch SM, Sah RL. Regulation of immature cartilage growth by IGF-I, TGF-beta 1, BMP-7, and PDGF-AB: role of metabolic balance between fixed charge and collagen network. Biomech Model Mechanobiol. 2008a;7:263–276. doi: 10.1007/s10237-007-0096-8. [DOI] [PMC free article] [PubMed] [Google Scholar]
- Asanbaeva A, Tam J, Schumacher BL, Klisch SM, Masuda K, Sah RL. Articular cartilage tensile integrity: Modulation by matrix depletion is maturation-dependent. Arch Biochem Biophys. 2008b;474(1):175–182. doi: 10.1016/j.abb.2008.03.012. [DOI] [PMC free article] [PubMed] [Google Scholar]
- Aspden RM. Relation between structure and mechanical behaviour of fibre-reinforced composite materials at large strains. Proc Roy Soc Lond A. 1986;406(1831):287–298. [Google Scholar]
- Ateshian GA. Anisotropy of fibrous tissues in relation to the distribution of tensed and buckled fibers. J Biomech Eng. 2007;129(2):240–249. doi: 10.1115/1.2486179. [DOI] [PMC free article] [PubMed] [Google Scholar]
- Ateshian GA, Rajan V, Chahine NO, Canal CE, Hung CT. Modeling the matrix of articular cartilage using a continuous fiber angular distribution predicts many observed phenomena. J Biomech Eng. 2009;131(6):061003. doi: 10.1115/1.3118773. [DOI] [PMC free article] [PubMed] [Google Scholar]
- Ball JM. Convexity conditions and existence theorems in non-linear elasticity. Arch Rational Mech Anal. 1976;63:337–403. [Google Scholar]
- Bursac P, McGrath CV, Eisenberg SR, Stamenovic D. A microstructural model of elastostatic properties of articular cartilage in confined compression. J Biomech Eng. 2000;122:347–353. doi: 10.1115/1.1286561. [DOI] [PubMed] [Google Scholar]
- Buschmann MD, Grodzinsky AJ. A molecular model of proteoglycan-associated electrostatic forces in cartilage mechanics. J Biomech Eng. 1995;117:179–192. doi: 10.1115/1.2796000. [DOI] [PubMed] [Google Scholar]
- Chahine NO, Wang CC, Hung CT, Ateshian GA. Anisotropic strain-dependent material properties of bovine articular cartilage in the transitional range from tension to compression. J Biomech. 2004;37:1251–1261. doi: 10.1016/j.jbiomech.2003.12.008. [DOI] [PMC free article] [PubMed] [Google Scholar]
- Chan E, Liu E, Semler E, Aberman HM, Simon TM, Truncale KG, Chen AC, Sah R. Association of 3-dimensional cartilage and bone structure with articular cartilage properties in and adjacent to autologous osteochondral grafts after 6 and 12 months in a goat model. Cartilage. 2012 doi: 10.1177/1947603511435272. accepted. [DOI] [PMC free article] [PubMed] [Google Scholar]
- Delesse MA. Procédé mécanique pour déterminer la composition des roches. Compt Rend Seances Acad Sci. 1847;25:544–545. [Google Scholar]
- Farquhar T, Dawson PR, Torzilli PA. A microstructural model for the anisotropic drained stiffness of articular cartilage. J Biomech Eng. 1990;112:414–425. doi: 10.1115/1.2891205. [DOI] [PubMed] [Google Scholar]
- Federico S, Gasser TC. Nonlinear elasticity of biological tissues with statistical fibre orientation. J R Soc Interface. 2010;7(47):955–966. doi: 10.1098/rsif.2009.0502. [DOI] [PMC free article] [PubMed] [Google Scholar]
- Ficklin TP, Thomas GC, Barthel JC, Asanbaeva A, Thonar EJ, Masuda K, Chen AC, Sah RL, Davol A, Klisch SM. Articular cartilage mechanical and biochemical property relations before and after in vitro growth. J Biomech. 2007;40:3607–3614. doi: 10.1016/j.jbiomech.2007.06.005. [DOI] [PMC free article] [PubMed] [Google Scholar]
- Garcia JJ, Cortes DH. A nonlinear biphasic viscohyperelastic model for articular cartilage. J Biomech. 2006;39(16):2991–2998. doi: 10.1016/j.jbiomech.2005.10.017. [DOI] [PubMed] [Google Scholar]
- Gasser TC, Ogden RW, Holzapfel GA. Hyperelastic modelling of arterial layers with distributed collagen fibre orientations. J R Soc Interface. 2006;3:15–35. doi: 10.1098/rsif.2005.0073. [DOI] [PMC free article] [PubMed] [Google Scholar]
- Gautieri A, Vesentini S, Redaelli A, Buehler MJ. Hierarchical Structure and Nanomechanics of Collagen Microfibrils from the Atomistic Scale Up. Nano Lett. 2011;11(2):757–766. doi: 10.1021/nl103943u. [DOI] [PubMed] [Google Scholar]
- Itskov M, Aksel N. A class of orthotropic and transversely isotropic hyperelastic constitutive models based on a polyconvex strain energy function. Int J Solids Struct. 2004;41:3833–3848. [Google Scholar]
- Jadin KD, Wong BL, Bae WC, Li KW, Williamson AK, Schumacher BL, Price JH, Sah RL. Depth-varying density and organization of chondrocyte in immature and mature bovine articular cartilage assessed by 3-D imaging and analysis. J Histochem Cytochem. 2005;53:1109–1119. doi: 10.1369/jhc.4A6511.2005. [DOI] [PubMed] [Google Scholar]
- Jin M, Grodzinsky AJ. Effect of electrostatic interactions between glycosaminoglycans on the shear stiffness of cartilage: a molecular model and experiments. Macromolecules. 2001;34:8330–8339. [Google Scholar]
- Julkunen P, Harjula T, Iivarinen J, Marjanen J, Seppänen K, Närhi T, Arokoski J, Lammi M, Brama P, Jurvelin J. Biomechanical, biochemical and structural correlations in immature and mature rabbit articular cartilage. Osteoarthritis and Cartilage. 2009;17(12):1628–1638. doi: 10.1016/j.joca.2009.07.002. [DOI] [PubMed] [Google Scholar]
- Julkunen P, Iivarinen J, Brama PA, Arokoski J, Jurvelin JS, Helminen HJ. Maturation of collagen fibril network structure in tibial and femoral cartilage of rabbits. Osteoarthr Cart. 2010;18(3):406–415. doi: 10.1016/j.joca.2009.11.007. [DOI] [PubMed] [Google Scholar]
- Jurvelin JS, Buschmann MD, Hunziker EB. Optical and mechanical determination of Poisson’s ratio of adult bovine humeral articular cartilage. J Biomech. 1997;30:235–241. doi: 10.1016/s0021-9290(96)00133-9. [DOI] [PubMed] [Google Scholar]
- Kiviranta P, Rieppo J, Korhonen RK, Julkunen P, Toyras J, Jurvelin JS. Collagen network primarily controls Poisson’s ratio of bovine articular cartilage in compression. J Orthop Res. 2006;24:690–699. doi: 10.1002/jor.20107. [DOI] [PubMed] [Google Scholar]
- Klisch SM. A bimodular polyconvex anisotropic strain energy function for articular cartilage. J Biomech Eng. 2007;129:250–258. doi: 10.1115/1.2486225. [DOI] [PubMed] [Google Scholar]
- Klisch SM, Asanbaeva A, Oungoulian SR, Thonar EJ, Masuda K, Davol A, Sah RL. A cartilage growth mixture model with collagen remodeling: validation protocols. J Biomech Eng. 2008;130:031006, 031001–031011. doi: 10.1115/1.2907754. [DOI] [PMC free article] [PubMed] [Google Scholar]
- Korhonen RK, Laasanen MS, Toyras J, Lappalainen R, Helminen HJ, Jurvelin JS. Fibril reinforced poroelastic model predicts specifically mechanical behavior of normal, proteoglycan depleted and collagen degraded articular cartilage. J Biomech. 2003;36(9):1373–1379. doi: 10.1016/s0021-9290(03)00069-1. [DOI] [PubMed] [Google Scholar]
- Kroon M. A continuum mechanics framework and a constitutive model for remodelling of collagen gels and collagenous tissues. Journal of the Mechanics and Physics of Solids. 2010;58(6):918–933. [Google Scholar]
- Lanir Y. Structure-strength relations in mammalian tendon. Biophys J. 1978;24:541–554. doi: 10.1016/S0006-3495(78)85400-9. [DOI] [PMC free article] [PubMed] [Google Scholar]
- Lanir Y. Constitutive equations for fibrous connective tissues. J Biomech. 1983;16:1–12. doi: 10.1016/0021-9290(83)90041-6. [DOI] [PubMed] [Google Scholar]
- Lei F, Szeri AZ. The influence of fibril organization on the mechanical behaviour of articular cartilage. Proc Roy Soc A. 2006;462:3301–3322. [Google Scholar]
- Lei F, Szeri AZ. Predicting articular cartilage behavior with a non-linear microstructural model. Open Mech J. 2007;1:11–19. [Google Scholar]
- Li L, Soulhat J, Buschmann MD, Shirazi-Adl A. Nonlinear analysis of cartilage in unconfined ramp compression using a fibril reinforced poroelastic model. Clin Biomechanics. 1999;14:673–682. doi: 10.1016/s0268-0033(99)00013-3. [DOI] [PubMed] [Google Scholar]
- Li LP, Herzog W, Korhonen RK, Jurvelin JS. The role of viscoelasticity of collagen fibers in articular cartilage: axial tension versus compression. Med Eng Phys. 2005;27(1):51–57. doi: 10.1016/j.medengphy.2004.08.009. [DOI] [PubMed] [Google Scholar]
- Lilledahl MB, Pierce DM, Ricken T, Holzapfel GA, Davies CL. Structural Analysis of Articular Cartilage Using Multiphoton Microscopy: Input for Biomechanical Modeling. IEEE transactions on medical imaging. 2011;30(9):1635. doi: 10.1109/TMI.2011.2139222. [DOI] [PubMed] [Google Scholar]
- Morales TI, Hascall VC. Transforming growth factor-β1 stimulates synthesis of proteoglycan aggregates in calf articular organ cultures. Arch Biochem Biophys. 1991;286:99–106. doi: 10.1016/0003-9861(91)90013-9. [DOI] [PubMed] [Google Scholar]
- Nguyen QT, Crawford DJ, Raub CB, Chen AC, Klisch SM, Sah RL. Application of chemical and dynamic mechanical stimuli to the surface of immature articular cartilage induces functional and structural maturation of the superficial zone. Trans Orthop Res Soc. 2012 [Google Scholar]
- Pierce D, Trobin W, Raya J, Trattnig S, Bischof H, Glaser C, Holzapfel G. DT-MRI Based Computation of Collagen Fiber Deformation in Human Articular Cartilage: A Feasibility Study. Annals of Biomedical Engineering. 2010;38(7):2447–2463. doi: 10.1007/s10439-010-9990-9. [DOI] [PubMed] [Google Scholar]
- Pierce DM, Trobin W, Trattnig S, Bischof H, Holzapfel G. A phenomenological approach toward patient-specific computational modeling of articular cartilage including collagen fiber tracking. J Biomech Eng. 2009;131:091006. doi: 10.1115/1.3148471. [DOI] [PubMed] [Google Scholar]
- Quinn TM, Morel V. Microstructural modeling of collagen network mechanics and interactions with the proteoglycan gel in articular cartilage. Biomech Model Mechanobiol. 2007;6(1–2):73–82. doi: 10.1007/s10237-006-0036-z. [DOI] [PubMed] [Google Scholar]
- Raub CBHS, Chan EF, Shirazi R, Chen AC, Chnari E, Semler EJ, Sah RL. Microstructural Remodeling of Articular Cartilage Following Defect Repair by Osteochondral Autograft Transfer. Osteoarthr Cart. 2012 doi: 10.1016/j.joca.2013.03.014. in revision. [DOI] [PMC free article] [PubMed] [Google Scholar]
- Raub CB, Hsu SC, Chan EF, Chen AC, Chnari E, Semler EJ, Sah RL. Trans Orthop Res Soc. San Francisco, CA: 2012a. The effect of osteochondral autograft on articular cartilage structure at 6 and 12 months in the goat; p. 739. [Google Scholar]
- Raub CB, Hsu SC, Chan EF, Chen AC, Truncale KG, Semler EJ, Sah RL. Trans Orthop Res Soc. Long Beach, CA: 2011. Microstructural remodeling of collagen at interfaces between implant and host in cartilage defect repair; p. 1586. [Google Scholar]
- Raub CB, Hsu SC, Goldberg I, Schoenhoff EK, Temple-Wong MM, Chen AC, Pauli C, D’Lima DD, Lotz MK, Sah RL. Trans Orthop Res Soc. San Francisco, CA: 2012b. Degeneration of human femoral condyle articular cartilage involves changes in collagen network orientation and anisotropy. Submitted. [Google Scholar]
- Rieppo J, Hallikainen J, Jurvelin JS, Kiviranta I, Helminen HJ, Hyttinen MM. Practical considerations in the use of polarized light microscopy in the analysis of the collagen network in articular cartilage. Microsc Res Tech. 2008;71(4):279–287. doi: 10.1002/jemt.20551. [DOI] [PubMed] [Google Scholar]
- Rieppo J, Hyttinen MM, Halmesmaki E, Ruotsalainen H, Vasara A, Kiviranta I, Jurvelin JS, Helminen HJ. Changes in spatial collagen content and collagen network architecture in porcine articular cartilage during growth and maturation. Osteoarthr Cart. 2009;17(4):448–455. doi: 10.1016/j.joca.2008.09.004. [DOI] [PubMed] [Google Scholar]
- Sacks MS. Incorporation of experimentally-derived fiber orientation into a structural constitutive model for planar collagenous tissues. J Biomech Eng. 2003;125(2):280–287. doi: 10.1115/1.1544508. [DOI] [PubMed] [Google Scholar]
- Sah RL, Chen AC, Grodzinsky AJ, Trippel SB. Differential effects of bFGF and IGF-I on matrix metabolism in calf and adult bovine cartilage explants. Arch Biochem Biophys. 1994;308:137–147. doi: 10.1006/abbi.1994.1020. [DOI] [PubMed] [Google Scholar]
- Schalkwijk J, Joosten LAB, van den Berg WB, van Wyk JJ, van de Putte LBA. Insulin-like growth factor stimulation of chondrocyte proteoglycan synthesis by human synovial fluid. Arthr Rheum. 1989;32:66–71. doi: 10.1002/anr.1780320111. [DOI] [PubMed] [Google Scholar]
- Schroder J, Neff P. Invariant formulation of hyperelastic transverse isotropy based on polyconvex free energy functions. Int J Solids Struct. 2003;40:401–445. [Google Scholar]
- Schwartz MH, Leo PH, Lewis JL. A microscructural model for the elastic response of articular cartilage. J Biomech. 1994;27(7):865–873. doi: 10.1016/0021-9290(94)90259-3. [DOI] [PubMed] [Google Scholar]
- Shirazi R, Shirazi-Adl A. Analysis of articular cartilage as a composite using nonlinear membrane elements for collagen fibrils. Med Eng Phys. 2005;27(10):827–835. doi: 10.1016/j.medengphy.2005.04.024. [DOI] [PubMed] [Google Scholar]
- Shirazi R, Vena P, Sah RL, Klisch SM. Modeling the collagen fibril network of biological tissues as a nonlinearly elastic material using a continuous volume fraction distribution function. Math Mech Sol. 2011;16(7):706–715. doi: 10.1177/1081286510387866. [DOI] [PMC free article] [PubMed] [Google Scholar]
- Soulhat J, Buschmann MD, Shirazi-Adl A. A fibril-network-reinforced biphasic model of cartilage in unconfined compression. J Biomech Eng. 1999;121:340–347. doi: 10.1115/1.2798330. [DOI] [PubMed] [Google Scholar]
- Stender ME, Balcom N, Berg-Johansen B, Dills KJ, Dyk D, Hazelwood SJ, Chen AC, Sah RL, Klisch SM. Differential regulation of articular cartilage tensile properties by IGF-1 and TGF-B1 during in vitro growth. International Conference on the Mechanics of Biomaterials and Tissues; Hawaii. 2011. [Google Scholar]
- Thomas GC, Asanbaeva A, Vena P, Sah RL, Klisch SM. A constituent-based nonlinear viscoelastic model for articular cartilage and analysis of tissue remodeling due to altered glycosaminoglycan-collagen interactions. J Biomech Eng. 2009;131:101002. doi: 10.1115/1.3192139. [DOI] [PMC free article] [PubMed] [Google Scholar]
- van Turnhout MC, Haazelager MB, Gijsen MAL, Schipper H, Kranenbarg S, van Leeuwen JL. Quantitative description of collagen structure in the articular cartilage of the young and adult equine distal metacarpus. Animal Biology. 2008;58(4):353–370. [Google Scholar]
- Van Turnhout MC, Kranenbarg S, van Leeuwen JL. Modeling optical behavior of birefringent biological tissues for evaluation of quantitative polarized light microscopy. Journal of biomedical optics. 2009;14:054018. doi: 10.1117/1.3241986. [DOI] [PubMed] [Google Scholar]
- van Turnhout MC, Kranenbarg S, van Leeuwen JL. Contribution of postnatal collagen reorientation to depth-dependent mechanical properties of articular cartilage. Biomech Model Mechanobiol. 2011;10(2):269–279. doi: 10.1007/s10237-010-0233-7. [DOI] [PubMed] [Google Scholar]
- van Turnhout MC, Schipper H, Engel B, Buist W, Kranenbarg S, van Leeuwen JL. Postnatal development of collagen structure in ovine articular cartilage. BMC Dev Biol. 2010;10:62. doi: 10.1186/1471-213X-10-62. [DOI] [PMC free article] [PubMed] [Google Scholar]
- Williams GM, Dills K, Flores C, Stender M, Stewart K, Nelson L, Chen A, Masuda K, Hazelwood S, Klisch SM, Sah RL. Differential regulation of immature articular cartilage compressive moduli and Poisson’s ratios by in vitro stimulation with IGF-1 and TGF-β1. J Biomech. 2010;43:2501–2507. doi: 10.1016/j.jbiomech.2010.05.022. [DOI] [PMC free article] [PubMed] [Google Scholar]
- Williams RP, Comper WD. Osmotic flow caused by polyelectrolytes. Biophys Chem. 1990;36:223–234. doi: 10.1016/0301-4622(90)80028-6. [DOI] [PubMed] [Google Scholar]
- Williamson AK, Chen AC, Masuda K, Thonar EJ-MA, Sah RL. Tensile mechanical properties of bovine articular cartilage: variations with growth and relationships to collagen network components. J Orthop Res. 2003;21:872–880. doi: 10.1016/S0736-0266(03)00030-5. [DOI] [PubMed] [Google Scholar]
- Williamson AK, Chen AC, Sah RL. Compressive properties and function-composition relationships of developing bovine articular cartilage. J Orthop Res. 2001;19:1113–1121. doi: 10.1016/S0736-0266(01)00052-3. [DOI] [PubMed] [Google Scholar]
- Wilson W, van Donkelaar CC, van Rietbergen B, Huiskes R. A fibril-reinforced poroviscoelastic swelling model for articular cartilage. J Biomech. 2005;38(6):1195–1204. doi: 10.1016/j.jbiomech.2004.07.003. [DOI] [PubMed] [Google Scholar]
- Wilson W, van Donkelaar CC, van Rietbergen B, Ito K, Huiskes R. Stresses in the local collagen network of articular cartilage: a poroviscoelastic fibril-reinforced finite element study. J Biomech. 2004;37:357–366. doi: 10.1016/s0021-9290(03)00267-7. [DOI] [PubMed] [Google Scholar]


