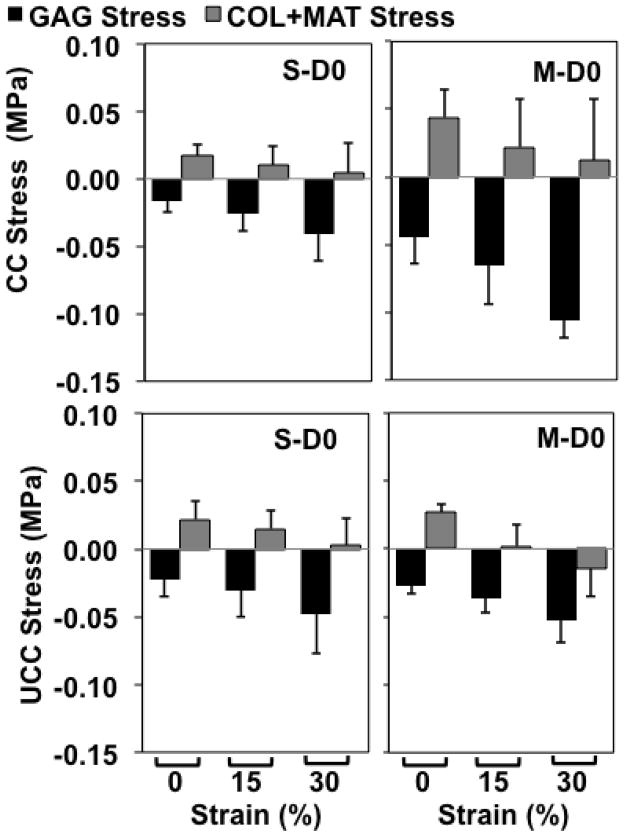
Figure 6.
Predicted values of and combined normal stresses in the direction of applied loading for confined (CC) and unconfined (UCC) compression tests. Groups correspond to superficial (S) and middle (M) layers untreated (D0). Predicted values shown as mean ± 1 standard deviation; n=7–15 per group. Vertical axis range is uniform for ease of comparison.

