
Figure 8.
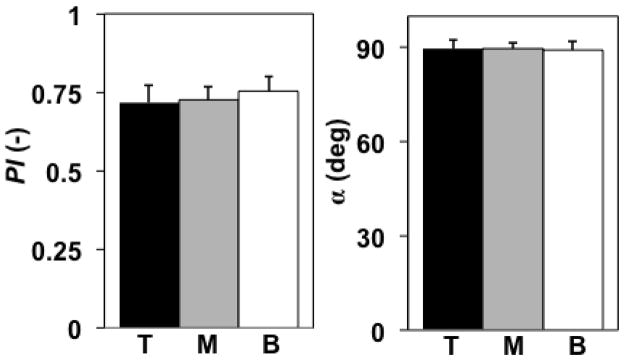
qPLM results (parallelism index PI, orientation angle α) averaged in the top (T), middle (M), and bottom (B) 1/3 tissue regions; mean ± 1 standard deviation values shown were calculated using mean values for each region of n=4 specimens. Neither PI nor α varied between 1/3 tissue regions (ANOVA, p=0.54, 0.98 respectively).