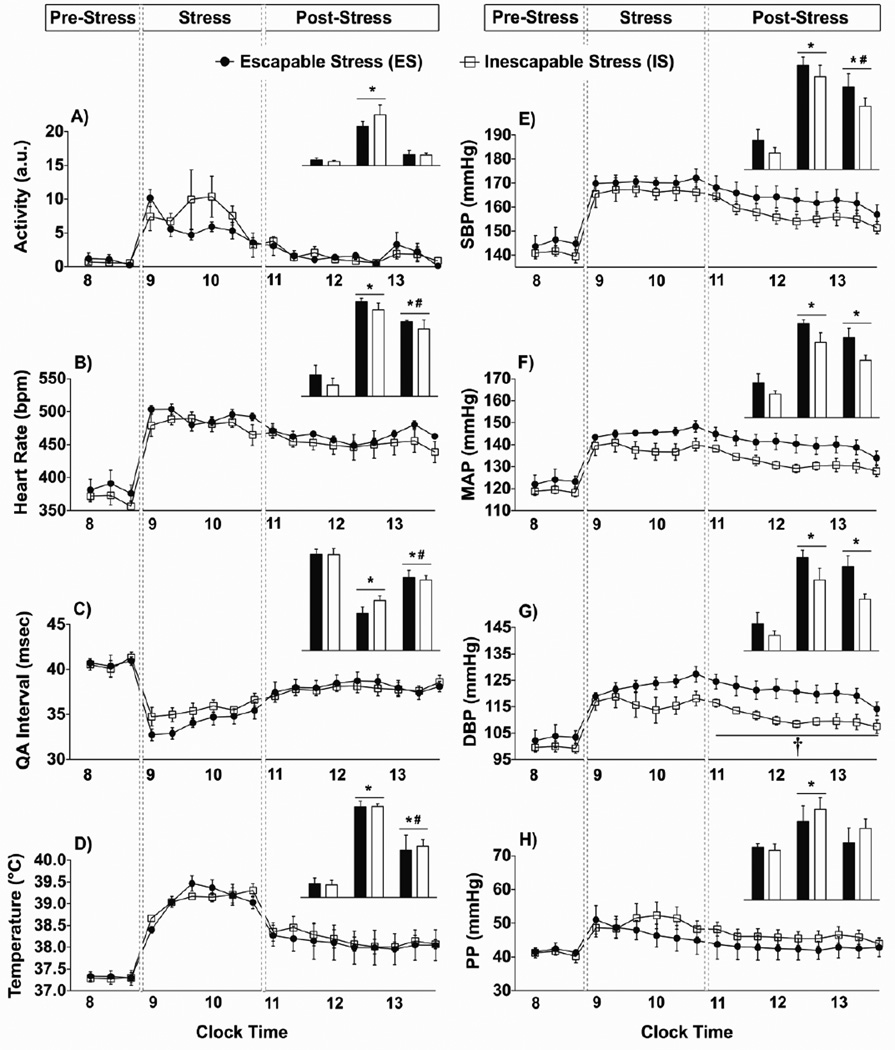
Figure 3.
Data are graphed in 20-minute blocks (or averaged, insets) before stress in the home cage, during stress, and immediately after stress upon return to the home cage. A) Locomotor activity was significantly increased during stress, but not after. B) Heart rate was significantly increased during stress and remained elevated after stressor exposure. C) QA interval was decreased during stress and remained decreased after stressor exposure. D) Core body temperature was significantly increased during stress and remained elevated after exposure. E-H) Systolic blood pressure (SBP), mean arterial pressure (MAP), diastolic blood pressure (DBP) and pulse pressure (PP) were significantly increased during stress. G) A higher DBP in the ES group developed during stress and remained significantly higher relative to the IS group in the home cage after exposure. (* p < 0.05 compared to pre-stress values; # p < 0.05 compared to during stress values; † p < 0.05 ES compared to IS)

