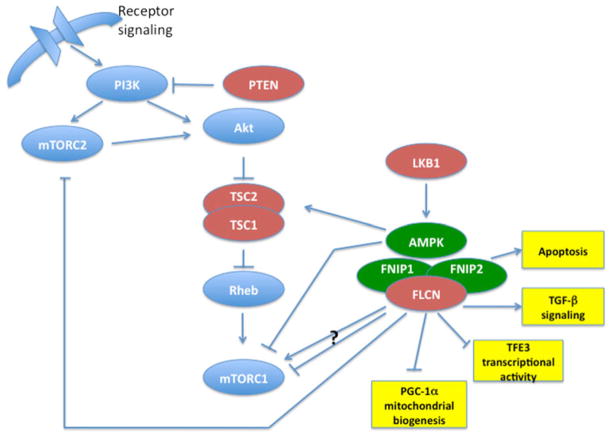
Fig. 2.
FLCN, FNIP1 and FNIP2 interact with AMPK and modulate mTOR signaling. Tumor suppressors are red. FLCN interactors are green. Potential functional interactions of FLCN/FNIP1/FNIP2 are in yellow boxes. Arrow indicates activation. Horizontal line with vertical end indicates inhibition. Question mark indicates conflicting data supporting both activation and inhibition.

