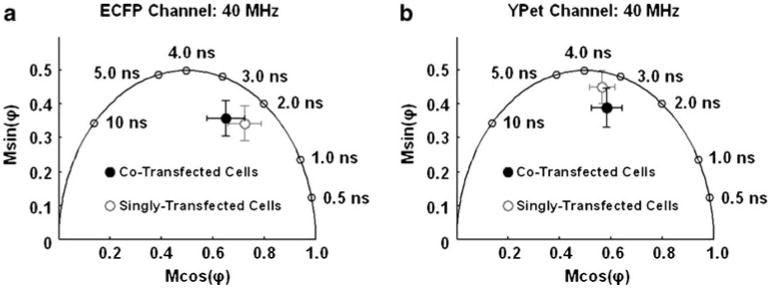
Fig. 3.

The polar plots describing the donor and acceptor on the MT1-MMP biosensor measured in HeLa cells: a As visualized through the ECFP channel, the average position on the polar plot of the HeLa cells (open circles, n=5) singly transfected with the MT1-MMP biosensor and the average position of the HeLa cells transfected with the MT1-MMP biosensor and MT1-MMP enzyme (filled circles, n=5) are shown. Error bars in x and y are the standard deviations in each coordinate axis. b The average polar positions of the same cells described in (a) are plotted here having been imaged through the YPet channel
