Fig. 4.

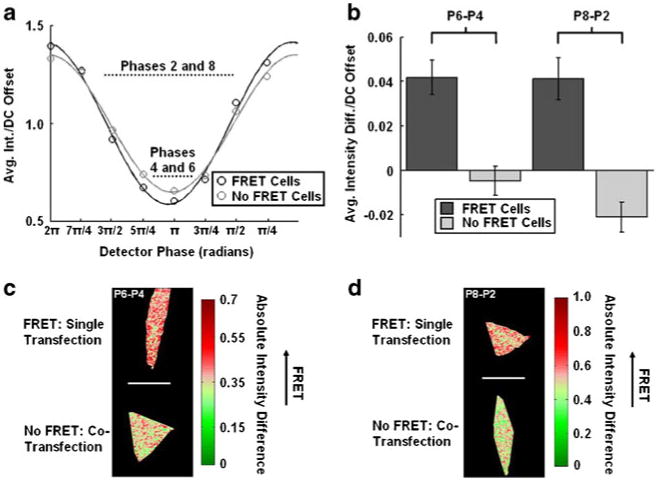
Phase differential enhancement applied to the ECFP channel characterizing the MT1-MMP biosensor in HeLa cells: a The average intensity of each phase image measured at the eight phases applied to our detector describing the MT1-MMP biosensor through the ECFP channel in singly- (intact biosensor with FRET, black, n=5) and co-transfected (cleaved biosensor without FRET, light gray, n=5) HeLa cells are shown. Also displayed are the fits corresponding to each curve used for the homodyne detection of each set of HeLa cells. The data points were normalized to their respective DC offsets for plotting and analysis. b The bar graphs show the average intensity differences/DC offset of the MT1-MMP biosensor in singly- (intact biosensor with FRET) and co-transfected (cleaved biosensor without FRET) HeLa cells after the phase image #6 or #8 was subtracted from those of #4 (P6-P4) or #2 (P8-P2), respectively. The error bars represent standard errors. c-d The representative cell images resulted from the phase differential enhancement in P6-P4 and P8-P2 groups
