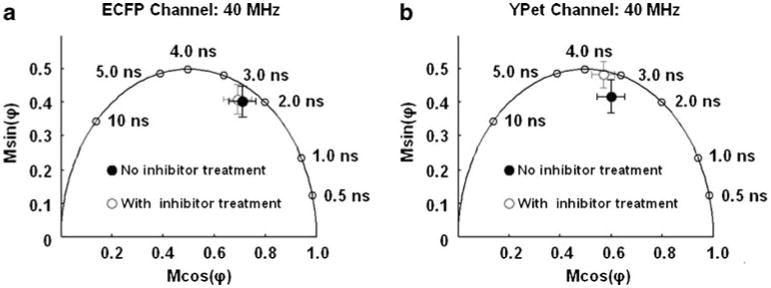
Fig. 5.

Variations in polar coordinate of ECFP and YPet on the MT1-MMP biosensor transfected into HT1080 cells: a The average position on the polar plot describing a set (n=5) of HT1080 cells transfected with the MT1-MMP biosensor and measured in the ECFP channel is shown as an open circle. The average position on the polar plot calculated from the data collected through the ECFP channel describing a set of HT1080 cells (n=5) incubated with the GM6001 inhibitor is indicated. Error bars are standard deviations in x and y. b The presented data depict the same cells as in (a), but visualized through the YPet channel
