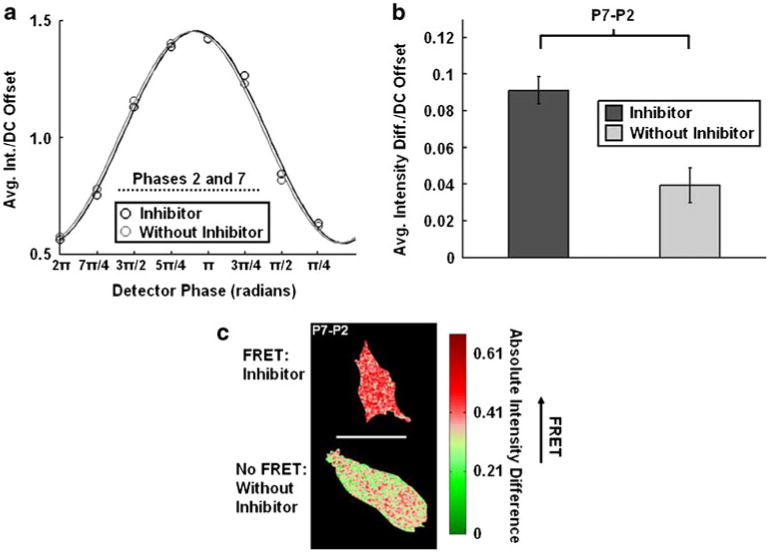
Fig. 6.

Examination of the MT1-MMP biosensor transfected into HT1080 cells using phase differential enhancement: a The average intensity of each phase image taken of the MT1-MMP biosensor in HT1080 cells treated with (intact biosensor with FRET, black, n=5) or without (cleaved biosensor without FRET, light gray, n=5) GM6001 for 12–18 h are shown as measured through the YPet channel. The corresponding fits used to extract the phase delay and modulation ratio for homodyne detection are also plotted. b The bar graphs show the average intensity differences/DC offset of the MT1-MMP biosensor HT1080 cells treated with (intact biosensor with FRET, black, n=5) or without (cleaved biosensor without FRET, light gray, n=5) GM6001 for 12–18 h after the phase image #7 was subtracted from that of #2 (P7-P2). The error bars represent standard errors. c This representative cell image resulted from the phase differential enhancement in the P7-P2 group
