
Figure 7.
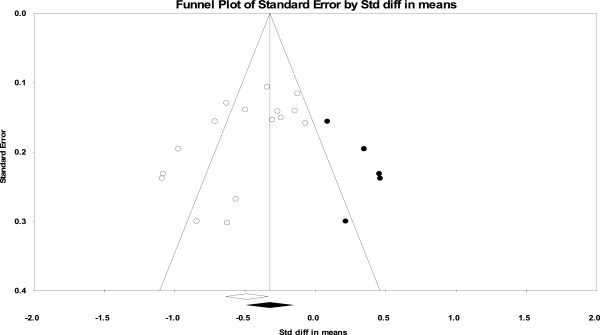
Funnel plot of comparison: CCBT versus control, outcome: reduction in depression symptoms at post-treatment. White circles: included comparisons. Black circles: imputed comparisons using the trim-and-fill methods. White diamond: pooled observed standard mean difference. Black diamond: pooled imputed standard mean difference.