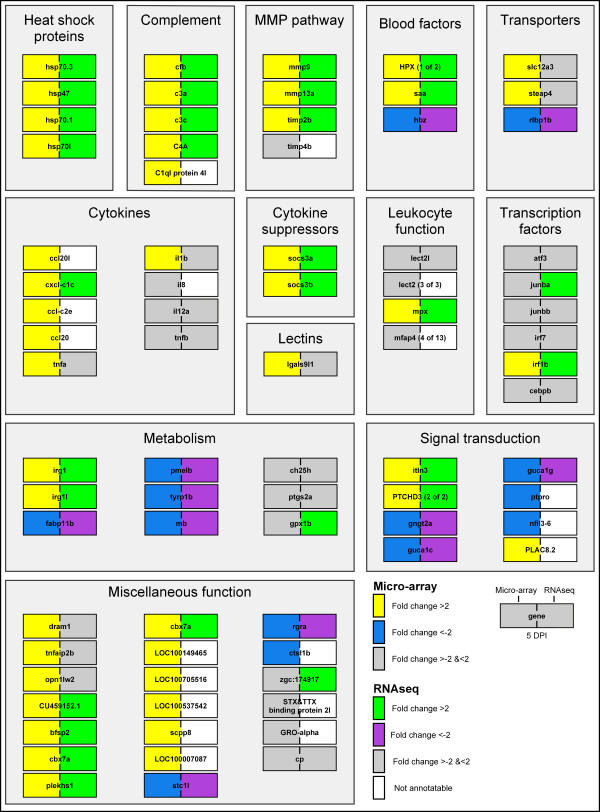
Figure 7.
Gene expression during M. marinum E11 infection. Micro-array data is shown for the infection of M. marinum at 5 DPI at the left side of each gene. The yellow boxes represent up-regulation and the blue boxes down-regulation with a P-value smaller than 10-8 and fold changes larger than 2 or smaller than −2. Probes with unchanged expression are indicated in grey. RNA deep sequencing data is shown for the same sample at the right side of each gene. Green boxes represent up-regulation and the purple boxes down-regulation with a P-value smaller than 0.02 and fold changes larger than 2 or smaller than −2. Genes were manually annotated and assigned to functional groups based on GO annotations of the zebrafish genes and their human homologues and on searching on PubMed abstracts. The D. rerio Uni-Gene Build # 124 or ENSEMBL Zv9 codes were used as shown with the raw data table in Additional file 6).

