
Fig. 4.
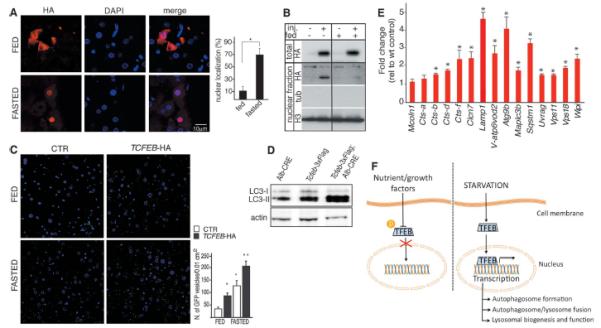
In vivo analysis of TFEB-mediated induction of autophagy. (A and B) Analysis of TFEB subcellular localization in 2-month-old WT mice infected with AAV2/9 Tcfeb-HA and fasted 16 hours before being killed. (A) Quantification of nuclear HA signal. HA-immunofluorescence analysis (red) and DAPI staining (blue); 100 transduced cells were counted for each liver. (B) Immunoblot analysis of HA, tubulin, and H3 in liver specimens subjected to nuclear fractionation. Total liver lysates were probed with an HA-specific antibody to verify comparable transgene expression between fed and fasted animals. (C) Immunofluorescence of GFP and DNA (DAPI) staining in cryopreserved liver slices from 2-month-old GFP-LC3 transgenic mice injected with either AAV-Tcfeb-HA or saline solution (control group) and fed ad libitum or fasted for 24 hours before being killed. Quantification of GFP-positive vesicles is shown in the graph. (D) Immunoblot analysis of LC3 and actin in liver protein extracts from Alb-CRE, Tcfeb-3xFlag, and Tcfeb-3xFlag; Alb-CRE mice. (E) QPCR analysis of both autophagic and lysosomal TFEB target gene expression in liver samples isolated from Alb-CRE, Tcfeb-3xFlag, and Tcfeb-3xFlag;Alb-CRE mice. (F) Model of phosphodependent TFEB regulation of the autophagic-lysosomal network during nutrient starvation. Values are means ± SEM; at least five mice per group were analyzed; *P < 0.05, **P < 0.001.