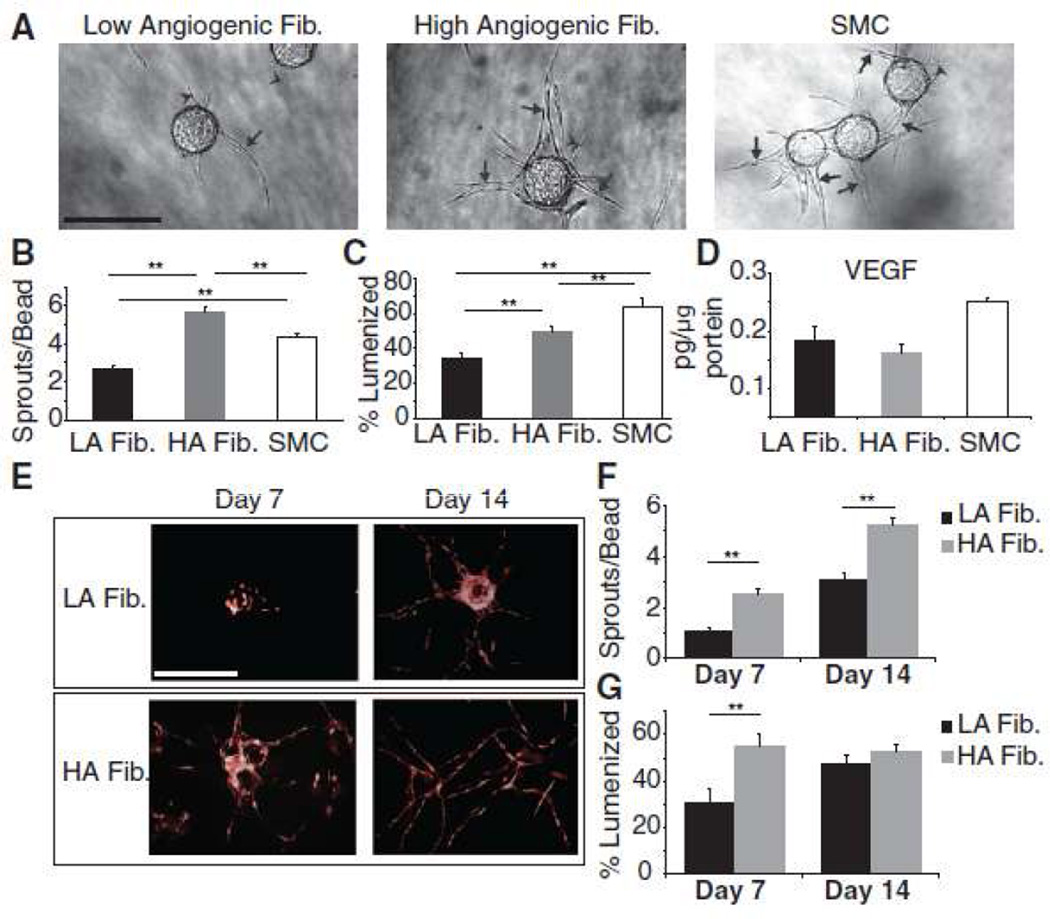
Figure 1.
(A) Representative images (stromal cells on top of gel). Arrows indicate EC sprouts with mature lumens, arrow heads indicate EC sprouts without lumens. Quantitation of (B) EC sprouting and (C) lumen formation. (D) VEGF ELISA. (E) Representative images of EC sprouting and lumen formation (stromal cells in gel). Quantitation of (E) EC sprouting and (F) lumen formation. Data shown are the average of 3 independent experiments, each with n = 20. Error bars represent standard error of the mean. ** indicates TukeyHSD p < 0.01 for comparisons with three cell isolates and Student’s t test p < 0.01 for comparisons between two isolates. Scale bars: 50µm

