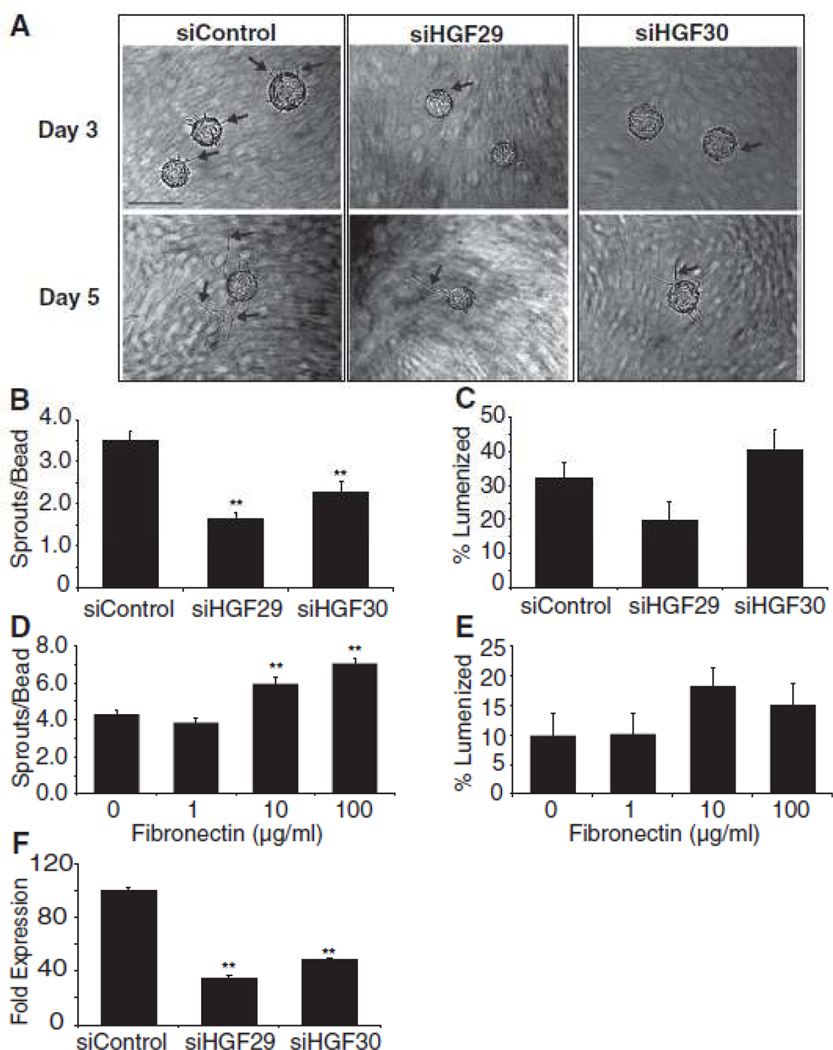
Figure 5.
(A) Representative images of angiogenesis in the presence of HA fibroblasts treated with control or HGF siRNA. Quantitation of (B) EC sprouting and (C) lumen formation. Arrows indicate EC sprouts. Scale bar: 50µm (D) qRT-PCR confirmation of HGF knockdown. Quantitation of (E) EC sprouting and (F) lumen formation in the presence of the indicated amount of fibronectin. Data shown are representative of three independent experiments. ** p < 0.01.

