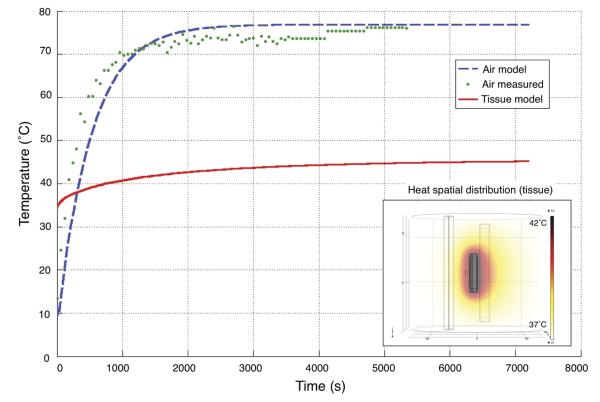
Figure 5.
Temperature vs. time profile of the neural interface during the charging process. The device was charged at a constant 60mA charging current (+30.2mA for the system itself to run), necessitating about 2W of forward powered from the external charger. Experimental temperature measurements in air on benchtop (green, dotted), modeled air calculations (blue, dashed), and modeled calculations of the system in biological tissue (red, solid) are shown in the figure. We operated the neural interface in the first 1000 seconds shown on this plot and applied active cooling to maintain skin temperature at or near 37°C.

