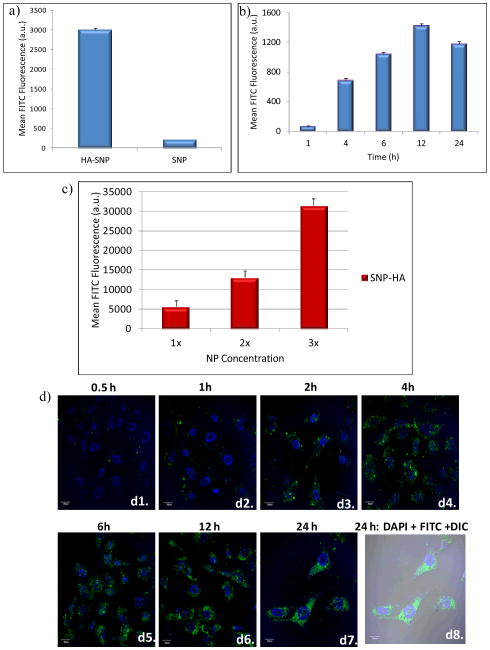
Figure 5.
(a) Flow cytometry analysis showed that the binding and uptake of HA-SNP by SKOV-3 cells was much higher than that by SNP (HA-SNP and SNP with equal fluorescent intensities were incubated with the cells). (b) Time dependent uptake of HA-SNP by SKOV-3 cancer cells as determined by flow cytometry. The uptake of HA-SNP reached a maximum after 12 h. c) Concentration dependent uptake of HA-SNP by SKOV-3 cancer cells as determined by flow cytometry (1x = 80 μg NP/mL). d) Confocal microscopy images supporting the time dependent uptake of HA-SNP by SKOV-3 cells. (d1–d7) shows the overlay of the DAPI and FITC channels, while (d8) shows the overlay of DAPI and FITC channels on DIC image.

