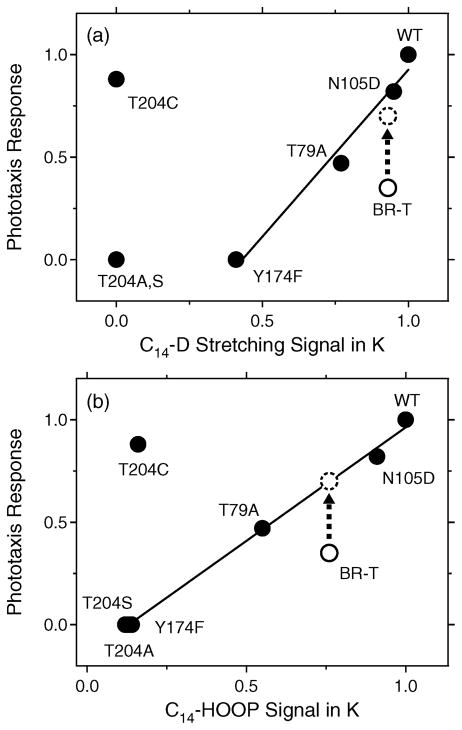
Figure 5.
Correlation between the C14–D stretching (a) or C14–HOOP (b) signals in the K photointermediate and Km values of phototaxis responses. The Km values were calculated from Michaelis–Menten fits to the fluence–response curves as described in ref 14. (a) The abscissa corresponds to the normalized area of the positive bands at 2244 cm−1 in Figures 2A and 3A. The straight line is the best linear fit to the data excluding the T204 mutants and BR-T. (b) The abscissa corresponds to the subtracted amplitude of the C14D-labeled retinal HOOP (dotted line) from the unlabeled retinal HOOP (solid line) at 864 cm−1 in Figures 2B and 3B. The straight line is the best linear fit to the data except for T204C and BR-T. The values for the wild-type SRII are normalized to unity in panels a and b. Dashed circles represent the corrected data for the all-trans form of BR-T, where the phototaxis response is doubled because BR-T possesses approximately half of the 13-cis form.

