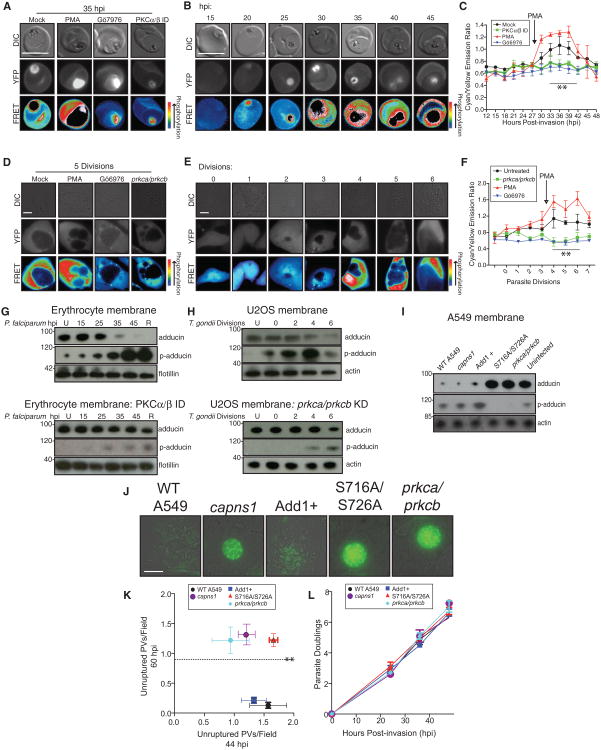
Figure 3. Host PKC Is Activated Late in the Parasite Intracellular Cycle and Abrogates Host Adducin Cytoskeletal Association.
(A–C) Assessment of host PKC activity through imaging and fluorometry of 3D7-CKAR P. falciparum parasites. (A) Representative control FRET images at 35 hpi. Positive control, 100 nM PMA; negative controls, PKCα/PKCβ depletion or 500 nM Gö6976. (B) Representative FRET images through the P. falciparum intracellular cycle. (C) CFP/YFP FRET fluorometry as a measurement of host PKC activity throughout the P. falciparum cycle. Data shown are mean fluorescence of at least three experiments ± SEM (**p < 0.01).
(D–F) Assessment of host PKC activity through imaging and fluorometry of T. gondii-infected U2OS cells expressing cytoplasmic CKAR. (D) Representative control FRET images at five parasite divisions.Positive control, 100nM PMA; negative controls, PKCα/PKCβ knockdown and 500 nM Gö6976. (E) Representative FRET images through the T. gondii intracellular cycle. (F) CFP/YFP FRET fluorometry as a measurement of host PKC activity throughout the T. gondii cycle. Data shown are mean fluorescence of at least three experiments ± SEM (**p < 0.01).
(G) Western blot analysis of erythrocyte cytoskeletal fraction through P. falciparum cycle in mock-treated erythrocytes (top) or erythrocytes depleted of PKCα/PKCβ (bottom). Loading control, actin.
(H) Western blot analysis of U2OS cytoskeletal fraction through T. gondii cycle in mock-treated cells (top) or PKCα/PKCβ-stable knockdown cells (bottom). Loading control, actin.
(I) Western blot analysis of A549 cytoskeletal fractions upon adducin mutant expression, following T. gondii infection at 44 hpi, compared to capns1 or prkca/prkcb stable knockdown. Add1+, adducin overexpression; S716A/S726A, PKC phospho mutant adducin expression; loading control, actin.
(J) Representative 60 hpi images of T. gondii vacuoles at 60 hpi following host cell manipulation as in (I).
(K) Quantitation of unruptured vacuoles at 60 versus 44 hpi following host cell manipulation as in (I). Data shown are means of at least four experiments ± SEM (**p < 0.01).
(L) Parasite doublings throughout life cycle following host cell manipulation as in (I). Also see Figure S3.

