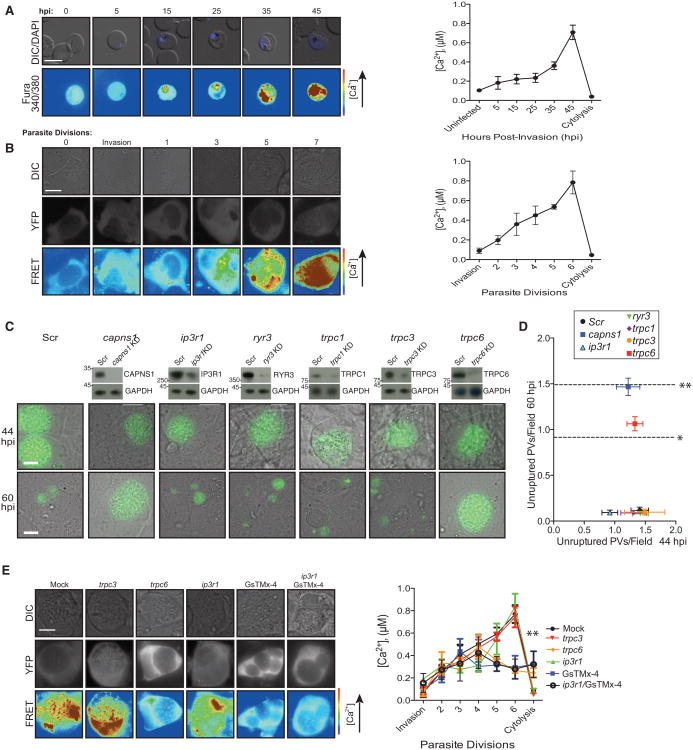
Figure 5. Host [Ca2+] Increases throughout the Last Third of the Intracellular Cycle in a TRPC6-Dependent Manner.
(A) Representative images of erythrocytes loaded with fura-2-dextran prior to challenge with synchronous P. falciparum parasites (left). [Ca2+] as a function of 340 nm/380 nm emission ratio (right). Data shown are mean calcium measurements of at least three experiments ± SEM.
(B) Representative images of T. gondii-infected U2OS cells expressing YC3.6 (left). [Ca2+] as a function of CFP/YFP FRET (right). Data shown are mean Ca2+ measurements of at least three experiments ± SEM.
(C) Representative images at 44 and 60 hpi of siRNA-mediated knockdown of cation channels prior to T. gondii infection. Positive control, Capns1; negative control, scr oligo. Data shown are mean unruptured vacuoles per field ± SEM (*p < 0.05; **p < 0.01).
(D) Quantitation at 44 and 60 hpi of siRNA-mediated knockdown of cation channels prior to T. gondii infection. Positive control, Capns1; negative control, scr oligo. Data shown are mean unruptured vacuoles per field ± SEM (*p < 0.05; **p < 0.01).
(E) Representative images (left) and [Ca2+] measurements as a function of CFP/YFP FRET (right) at 5 T. gondii divisions (∼35 hpi) following siRNA-mediated knockdown of cation channels in U2OS cells expressing YC3.6. Data shown are mean Ca2+ measurements ± SEM. Also see Figure S4.

